Market Snapshot
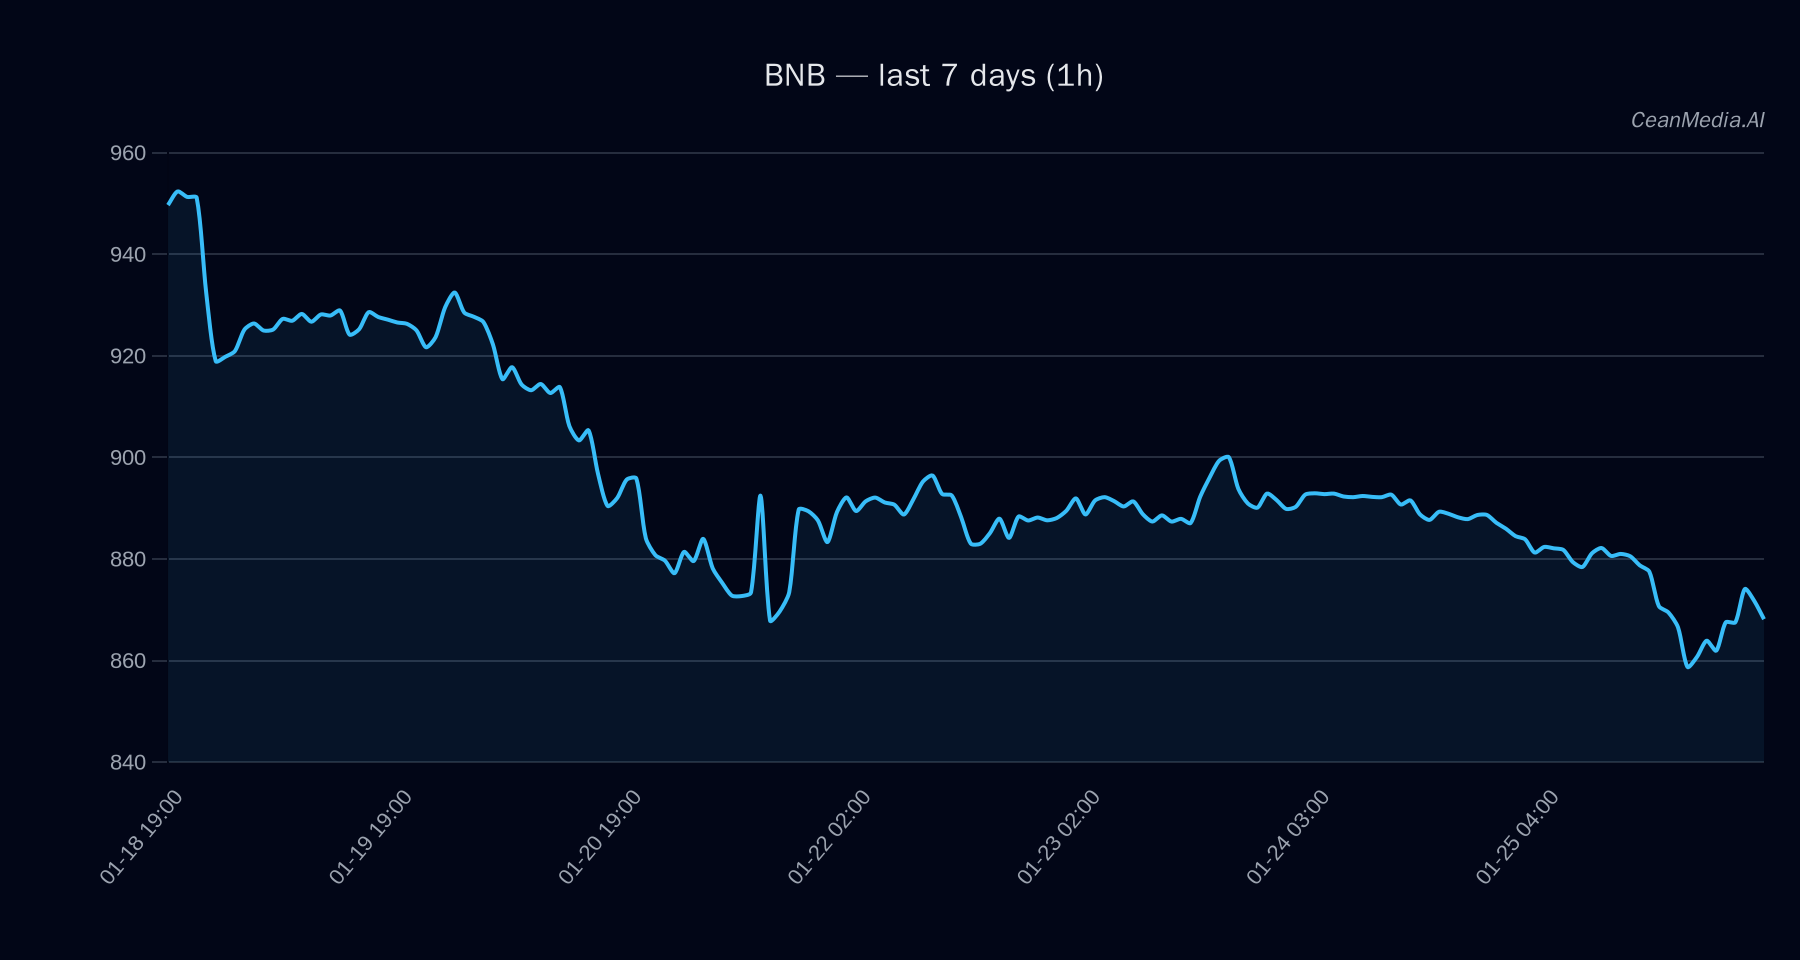
On January 26, 2026, BNB is trading around $871.93 with a neutral short-term bias. The market exhibits very low volatility regimes, with the RSI at 46, indicating a balanced momentum. Major support is identified at $854, while resistance is at $889. Recent ETF flows for BTC and ETH are negative, suggesting risk-off sentiment in broader crypto markets, which may influence BNB indirectly.
Technical Analysis: BNB
Currently, BNB sits between support at $854 and resistance at $889. The technical indicators show a bearish trend with the EMA12 below EMA26 and the SMA50 below SMA200. The RSI at 46 remains neutral, not signaling overbought or oversold conditions. A close above $889 would target a move toward $907.16 to $924.94, whereas a drop below $854 could see prices decline to between $837.40 and $820.31. The overall bias remains cautious with a 49% probability of upward movement, but current signals are somewhat bearish, requiring confirmation of a breakout or breakdown for directional clarity.
Drivers
- Return 24H: -0.01%
- EMA Slope: -0.0003, indicating slight downward momentum
- Funding Z-Score: -0.2, reflecting modest bearish funding pressure
- Basis Z-Score: 0.18, neutral to slightly bullish
- Order Book Imbalance (EMA5): -0.05, showing slight sell-side pressure
- BTC Return 24H: -0.02%, suggesting a risk-off environment
- BTC Trend Strength: 1, indicating a stable trend in Bitcoin
The overall momentum remains subdued with very low volatility, and the market sentiment is characterized by a neutral to cautious outlook.
ETF Flows (BTC/ETH)
Recent ETF data shows significant outflows for both BTC and ETH, with BTC ETFs down by approximately $1.34 billion over five days and ETH ETFs decreasing by around $301 million in the same period. This persistent withdrawal indicates a risk-off environment, which could weigh on broader crypto markets, including BNB. However, it is important to note that these ETF flows are specific to BTC and ETH and serve as contextual indicators rather than direct signals for BNB’s price action.
What to Watch Next
- Monitor if BNB breaks above resistance at $889 for confirmation of bullish continuation.
- Watch for a breakdown below support at $854, which could lead to further declines toward $820–837.
- Observe broader market sentiment as indicated by ETF flows, especially if risk-off persists.
- Keep an eye on Bitcoin’s trend strength and volatility, as they influence altcoin performance.
Hashtags: #BNB #CryptoAnalysis #TechnicalAnalysis #ETFFlows #Bitcoin #Altcoins #MarketUpdate #CryptoTrends #PriceLevels #MarketSentiment