Market Snapshot
On January 26, 2026, XRP is trading around $1.88, with a short-term forecast indicating a 47% probability of upward movement. The broader market sentiment shows low volatility with a very low regime and a Fear indicator at Extreme Fear levels. ETF flows for Bitcoin and Ethereum are currently negative, reflecting risk-off sentiment in traditional and crypto markets.
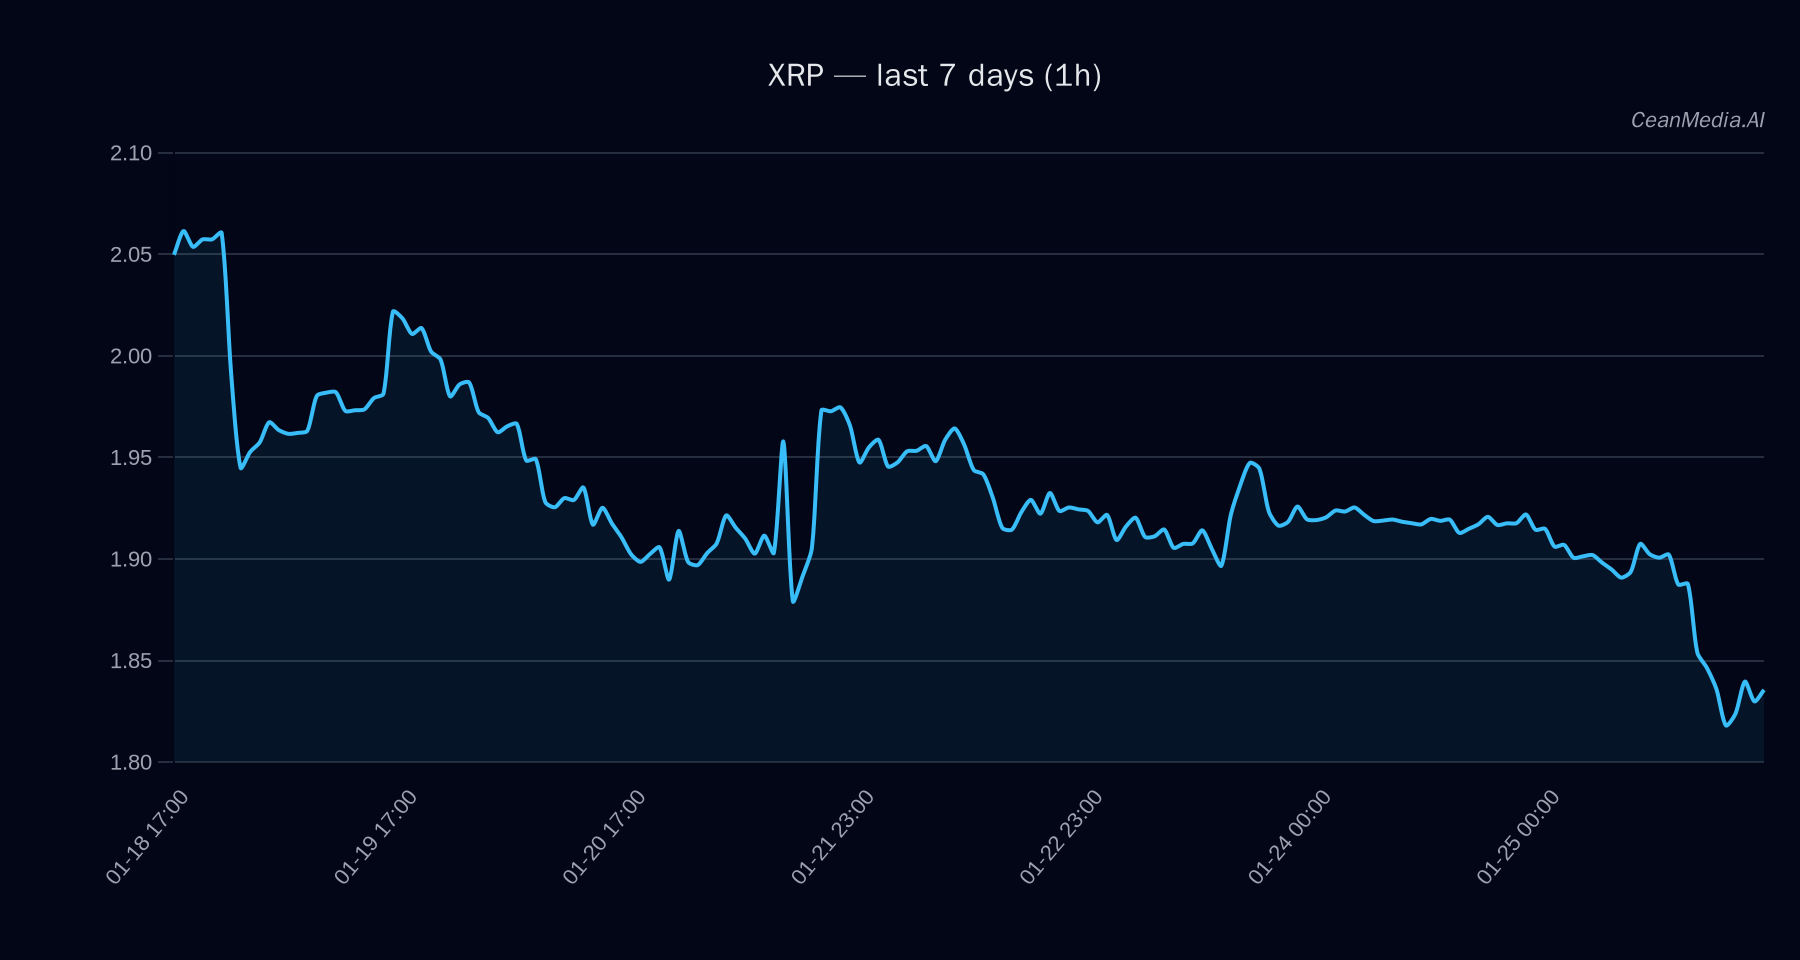
Technical Analysis: XRP
XRP is situated between key support at approximately $1.84 and resistance at around $1.92. A breakout above $1.92 could propel the price towards $1.95–1.99, while a decline below support may lead to levels near $1.76–1.80. The trend remains bearish in the short term, as indicated by EMA12 being below EMA26, and SMA50 under SMA200. The RSI stands neutral at 50, suggesting neither overbought nor oversold conditions. The current technical bias favors a potential upward move if resistance levels are broken, but invalidation occurs if price drops below support.
Drivers
- Return 24H: -0.04
- EMA Slope: -0.0015
- Funding Z-Score: -2.19
- Basis Z-Score: -1.59
- Order Book Imbalance (EMA5): 0.14
- Market Volatility Regime: Very low
Market momentum remains subdued, with key drivers pointing towards a cautious stance. The negative funding and basis z-scores suggest bearish pressure, but the order book imbalance indicates some buying interest at shorter timeframes.
ETF Flows (BTC/ETH)
Recent ETF flows for Bitcoin and Ethereum highlight significant outflows, with Bitcoin ETFs down by approximately $1.34 billion over five days and Ethereum ETFs declining by around $301 million in the same period. These outflows signal a risk-off environment, which can influence overall market sentiment. However, it is important to note that ETF data pertains only to BTC and ETH and should be viewed as contextual, not primary, signals for XRP or other altcoins.
What to Watch Next
- Monitor if XRP breaks above the resistance at $1.92 for a potential move towards $1.95–1.99.
- Watch for a decline below support at $1.84, which could lead to further downside toward $1.76–1.80.
- Observe overall market sentiment, especially ETF outflows in BTC and ETH, for signs of risk appetite or aversion.
- Keep an eye on broader volatility levels and potential shifts in funding and basis z-scores for early trend signals.
Note: The ETF flows are only for BTC and ETH and serve as broader market context rather than direct indicators for XRP price action.
Hashtags: #XRP #CryptoAnalysis #MarketUpdate #TechnicalAnalysis #CryptoTrends #Bitcoin #Ethereum #ETFFlows #RiskOff #Altcoins #MarketSentiment #TradingStrategy