Market Snapshot
On January 27, 2026, BNB is trading around $883.84 with a short-term forecast indicating a 47% probability of upward movement. The broader market shows low volatility, with a very low volume regime and strong correlation with Bitcoin’s recent trend. ETF flows for Bitcoin and Ethereum remain negative over multiple timeframes, suggesting a risk-off sentiment prevailing in the crypto space.
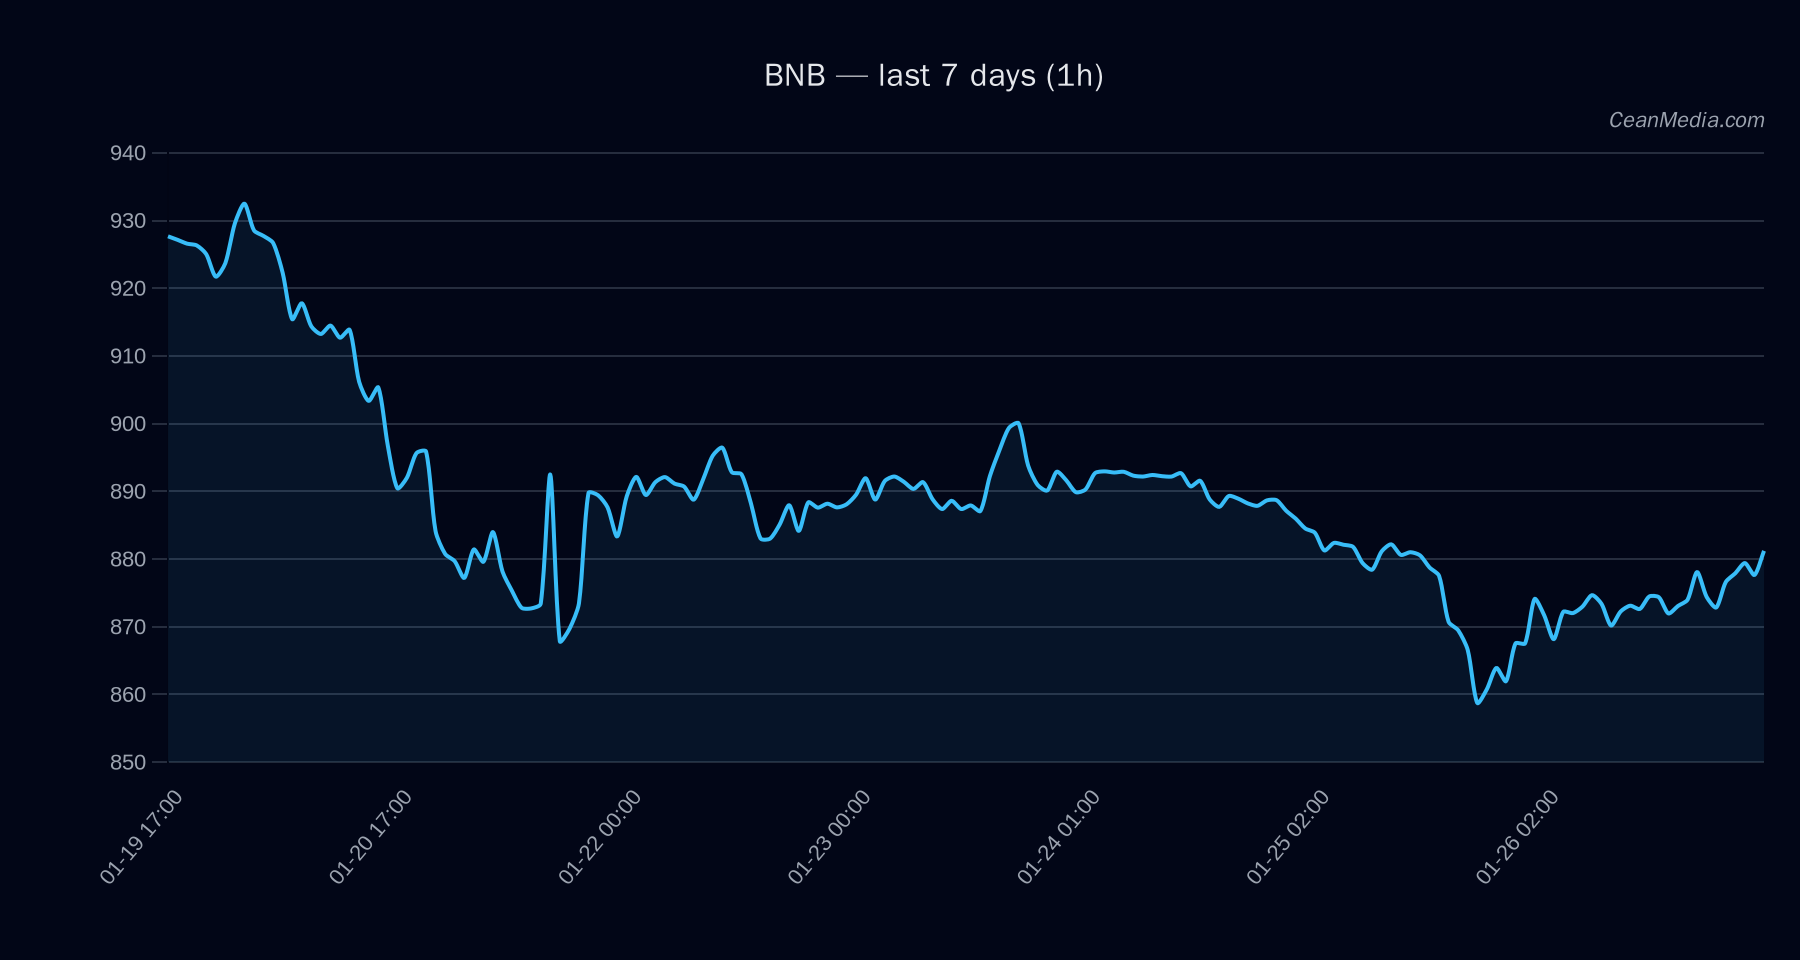
Technical Analysis: BNB
BNB is currently trading between key support at approximately $866 and resistance at around $902. The technical indicators present a sideways bias, with the EMA12 above EMA26, and the SMA50 below SMA200, indicating a mixed trend. The RSI stands at 63, reflecting neutral momentum. A break above $902 could target levels near $920–$938, while a breakdown below $866 may see prices decline toward $832–$849. The current setup suggests a cautious outlook with potential for either breakout or breakdown depending on short-term price action.
Drivers
- Return 24H: +0.01%
- EMA Slope: Slight positive at 0.0004, indicating minimal upward momentum
- Funding Z-Score: 1.14, suggesting moderate funding activity
- Order Book Imbalance (EMA5): 0.0098, showing slight buy-side pressure
- BTC Return 24H: +0.02%, correlating with BNB’s sideways movement
- BTC Trend Strength: 0.94, indicating a strong Bitcoin trend but not necessarily translating into immediate BNB direction
Overall, momentum remains subdued with low volatility, and key drivers point to a neutral stance in the near term.
ETF Flows (BTC/ETH)
Recent ETF flow data shows significant outflows for both Bitcoin and Ethereum, with BTC ETF outflows of approximately $1.03 billion over one day and $1.34 billion over five days. ETH ETF outflows are also notable, with $41.7 million daily and over $300 million in five days. These persistent outflows suggest a risk-off environment, which could impact broader market sentiment. However, it is important to note that ETF flows for BTC and ETH are only contextual and do not directly influence BNB’s technical outlook.
What to Watch Next
- Monitor for a decisive break above $902 for potential upward acceleration toward $920–$938.
- Watch for a breakdown below $866, which could lead to a decline toward $832–$849.
- Observe Bitcoin and Ethereum ETF flows for signs of risk appetite or aversion in the broader crypto market.
- Keep an eye on volume and volatility shifts to confirm breakout or breakdown signals.
Hashtags: #BNB #CryptoAnalysis #TechnicalAnalysis #ETFFlows #MarketUpdate #Bitcoin #Ethereum #Altcoins #CryptoTrends #RiskOnOff