Market Snapshot
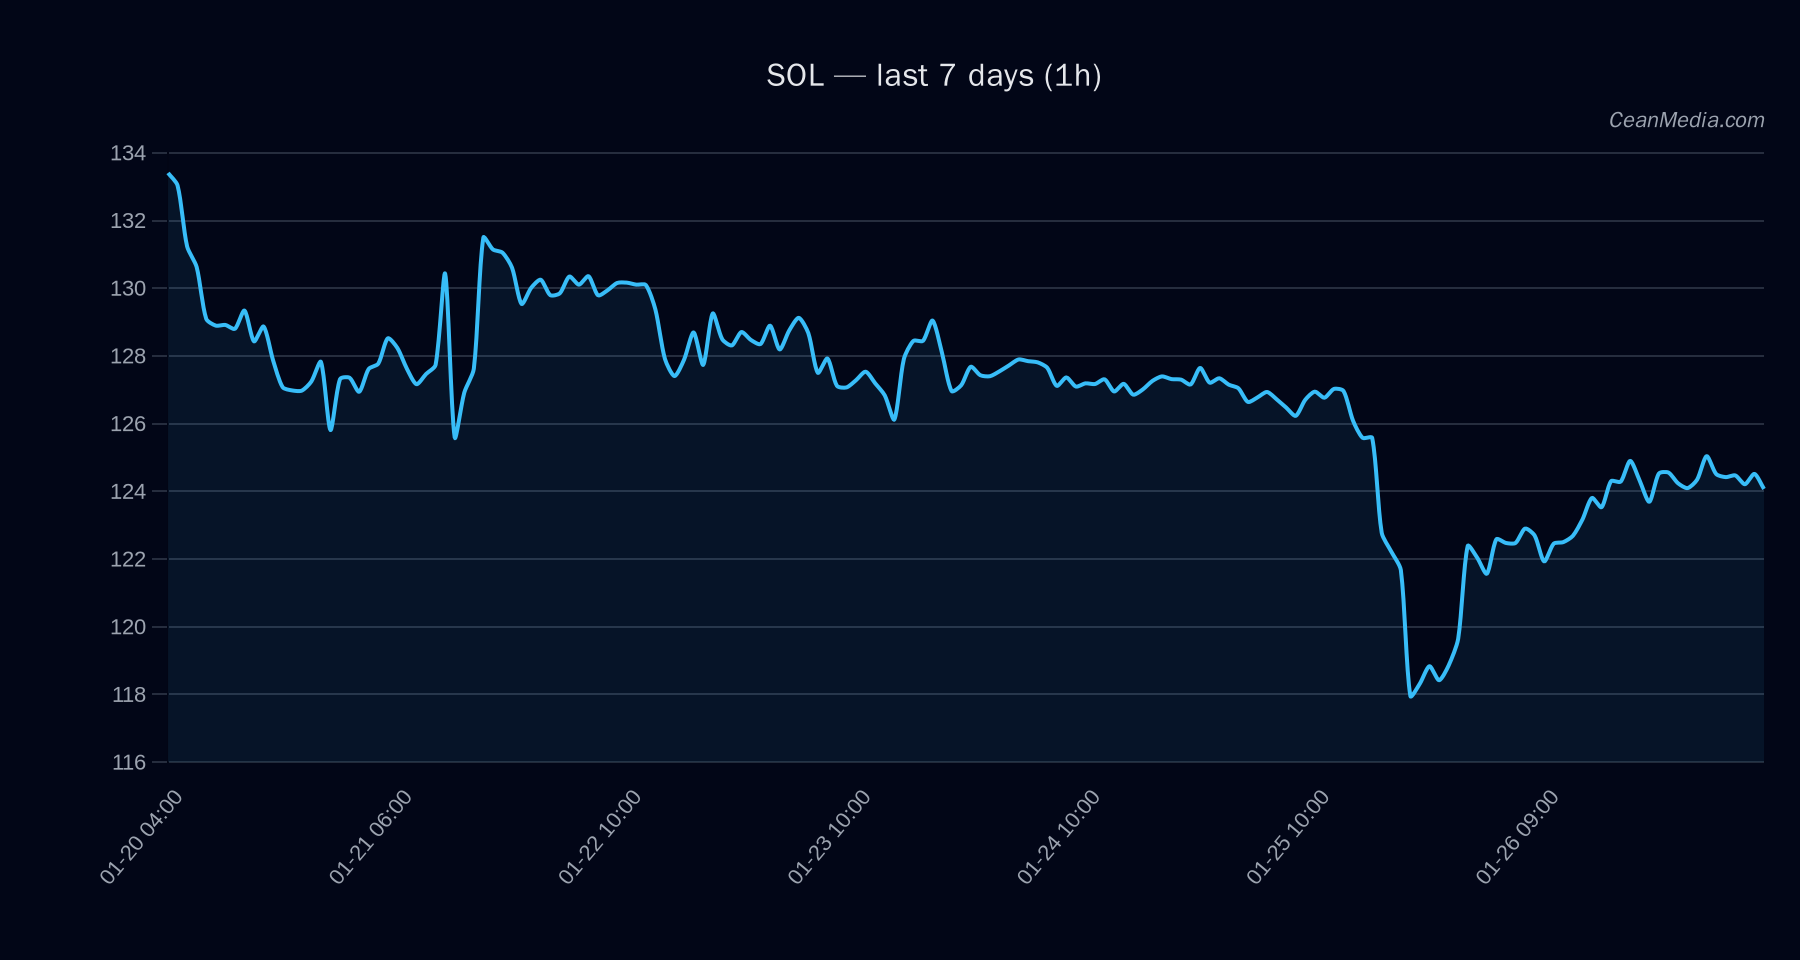
As of January 27, 2026, Solana (SOL) is trading near key support and resistance levels, with the current price at approximately $123.60. The broader market exhibits low volatility and a sideways trend, with a slight bullish bias suggested by recent technical indicators. ETF flows in Bitcoin and Ethereum provide additional context for overall risk sentiment, though they are not primary drivers for SOL.
Technical Analysis: SOL
Solana is currently positioned between the support level of $121 and resistance at $126. A break above $126 could propel the price towards the $128.59 to $131.11 range, while a breakdown below $121 may lead to a decline towards $118.71 to $116.28. The technical bias is neutral to slightly bullish, supported by the EMA12 being above EMA26, and the SMA50 remaining below the SMA200, indicating a sideways trend. The RSI at 47 confirms a neutral momentum, with very low volatility (σ24h at 0.40%).
Drivers
- Return 24H: +0.01%
- EMA Slope: 0.0003, indicating a subtle upward momentum
- Funding Z-Score: 0.67, suggesting balanced funding conditions
- Order Book Imbalance (EMA5): 0.03, indicating slight buy-side pressure
- BTC 24H Return: +0.0036%, reflecting stable Bitcoin performance
- Market Volatility Regime: Very low, indicating subdued trading activity
Overall, the drivers point towards a cautious sideways movement with no strong immediate momentum in either direction.
ETF Flows (BTC/ETH)
Recent ETF flow data shows a significant outflow from Bitcoin ETFs, with 1-day flows at -$9.1M, and cumulative 5-day flows at -$954.2M. Conversely, Ethereum ETFs have experienced inflows, with +$137.2M in the past day and positive flows over 5 and 10 days. These movements suggest a slight risk-on sentiment favoring ETH over BTC but should be interpreted as context rather than direct signals for SOL. The overall risk environment remains cautious, with ETF flows indicating a preference shift within the crypto space but not necessarily influencing SOL directly.
What to Watch Next
- Monitor if SOL breaks above the resistance at $126 for potential upward acceleration.
- Watch for a decline below $121 that could trigger further downside.
- Observe broader market volatility and ETF flow trends for risk sentiment shifts.
- Keep an eye on Bitcoin and Ethereum ETF flows as potential macro indicators for market sentiment.
Hashtags: #Solana #CryptoAnalysis #MarketUpdate #Bitcoin #Ethereum #ETFFlows #TechnicalAnalysis #CryptoTrends #Blockchain #DigitalAssets #CryptoInvesting #MarketInsights