Market Snapshot
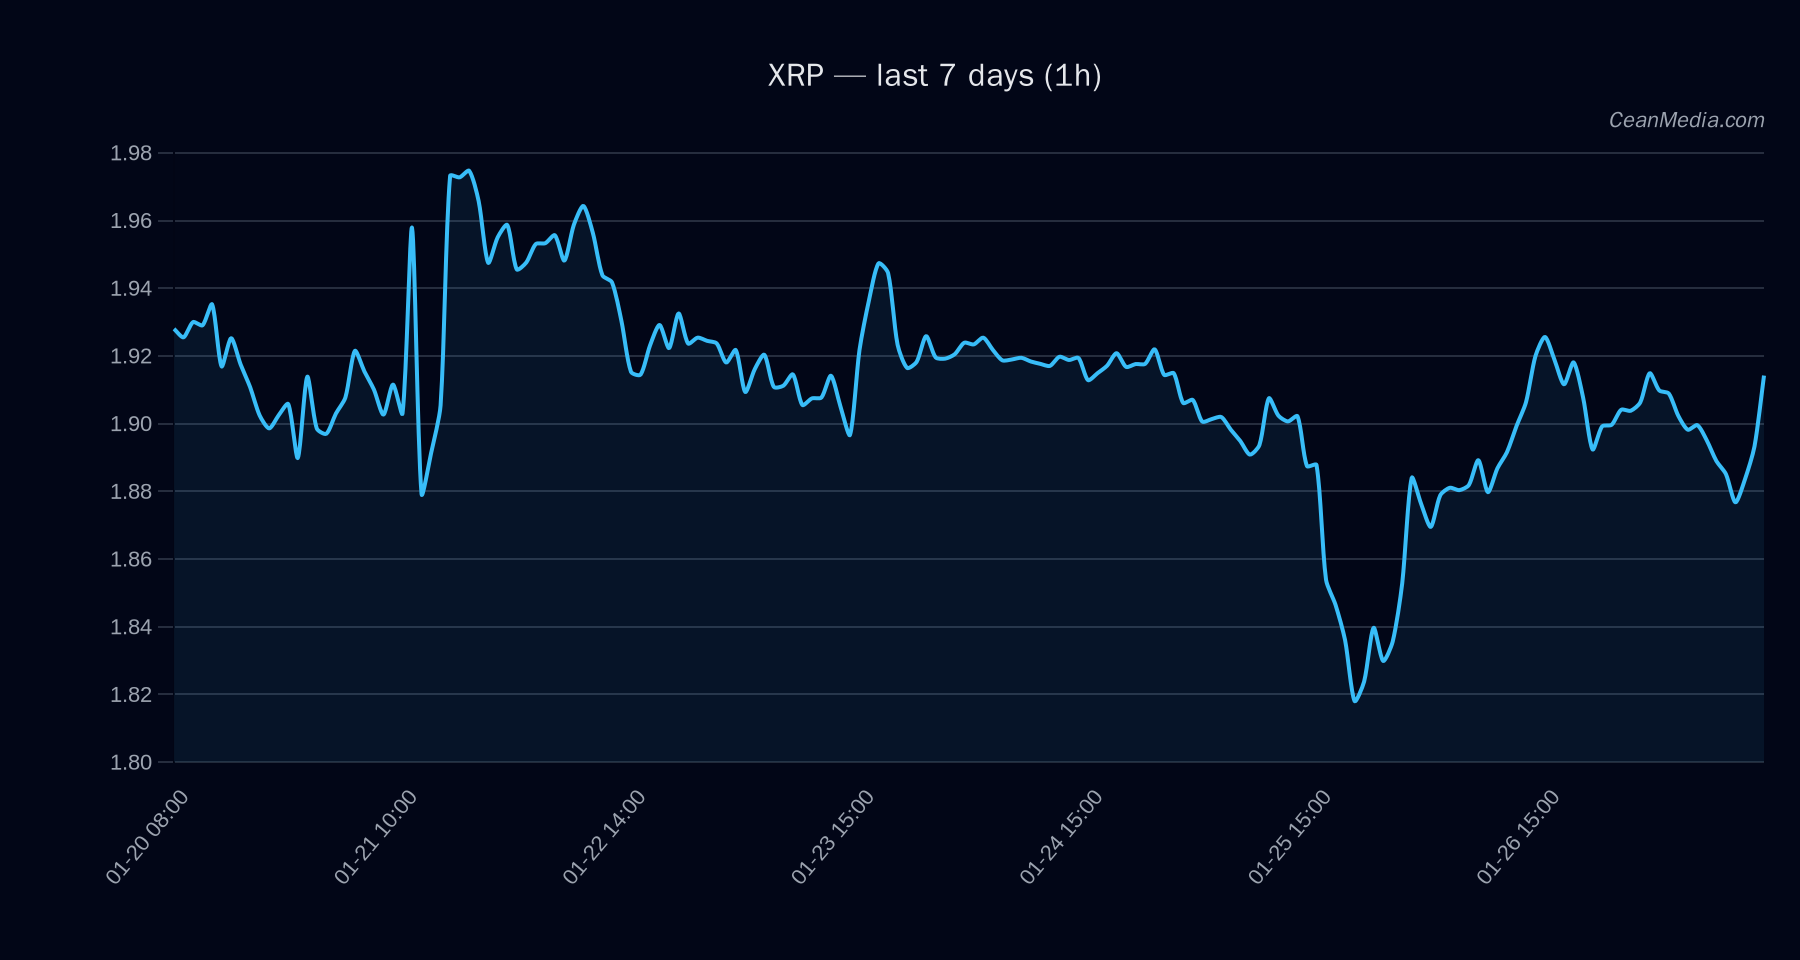
As of January 27, 2026, XRP is trading around $1.8787, with a short-term bearish bias indicated by technical signals. The broader market shows cautious sentiment, with ETF flows for Bitcoin and Ethereum providing additional context for risk appetite.
Technical Analysis: XRP
XRP is currently situated between key support at approximately $1.84 and resistance near $1.92. A break above $1.92 could target the next resistance zone around $1.9546 to $1.9929, while a breakdown below $1.84 could see prices decline toward $1.8043 to $1.7675. Technical indicators suggest a bearish trend, with EMA12 below EMA26, and the SMA50 below SMA200. The RSI stands at 41, indicating neutral momentum. The current volatility regime is very low, further emphasizing subdued trading activity.
Drivers
- Return 24H: Slight negative at -0.0024, indicating minimal recent price decline.
- EMA Slope: Slight positive at 0.0017, suggesting a subtle upward trend in short-term momentum.
- Funding Z-Score: -0.1, reflecting slight negative funding pressure.
- Order Book Imbalance (EMA5): -0.02, indicating marginal selling pressure.
- BTC Return 24H: +1%, providing a modest positive influence from Bitcoin markets.
- Market Volatility Regime: Very low, pointing to subdued trading conditions.
- Market Sentiment: Fear index at 29, indicating cautious investor sentiment.
Overall, momentum remains subdued with a slight bearish tilt, although technical indicators are not signaling an immediate trend reversal.
ETF Flows (BTC/ETH)
Recent ETF flows show increased interest in Bitcoin, with a 1-day inflow of +$6.8 million, but significant outflows over 5 days totaling -$938.3 million. Ethereum ETFs have experienced a 1-day inflow of +$119.5 million, though 5-day flows are negative at -$186.5 million. These flows suggest a cautious risk-on environment for Bitcoin and Ethereum, which may influence broader market sentiment, but should be interpreted as context rather than primary signals for XRP.
What to Watch Next
- Monitor if XRP breaks above the resistance at $1.92 to confirm potential upward continuation.
- Watch for a breakdown below support at $1.84, which could accelerate downside momentum.
- Keep an eye on Bitcoin and Ethereum ETF flows for signs of shifting risk appetite.
- Observe changes in technical momentum indicators, especially RSI and EMA slopes, for early trend signals.
Hashtags: #XRP #CryptoAnalysis #MarketUpdate #Bitcoin #Ethereum #ETFFlows #TechnicalAnalysis #CryptoTrends #MarketSentiment #RiskOnOff #DigitalAssets