Market Snapshot
As of January 29, 2026, BNB is trading around $904.69, with a short-term bullish bias indicated by technical signals. The broader market context shows significant ETF outflows from Bitcoin and Ethereum, suggesting a cautious risk environment. Notably, Bitcoin ETFs have seen consistent redemptions over the past 10 days, while ETH ETFs have experienced mixed flows, with recent inflows over the last five days.
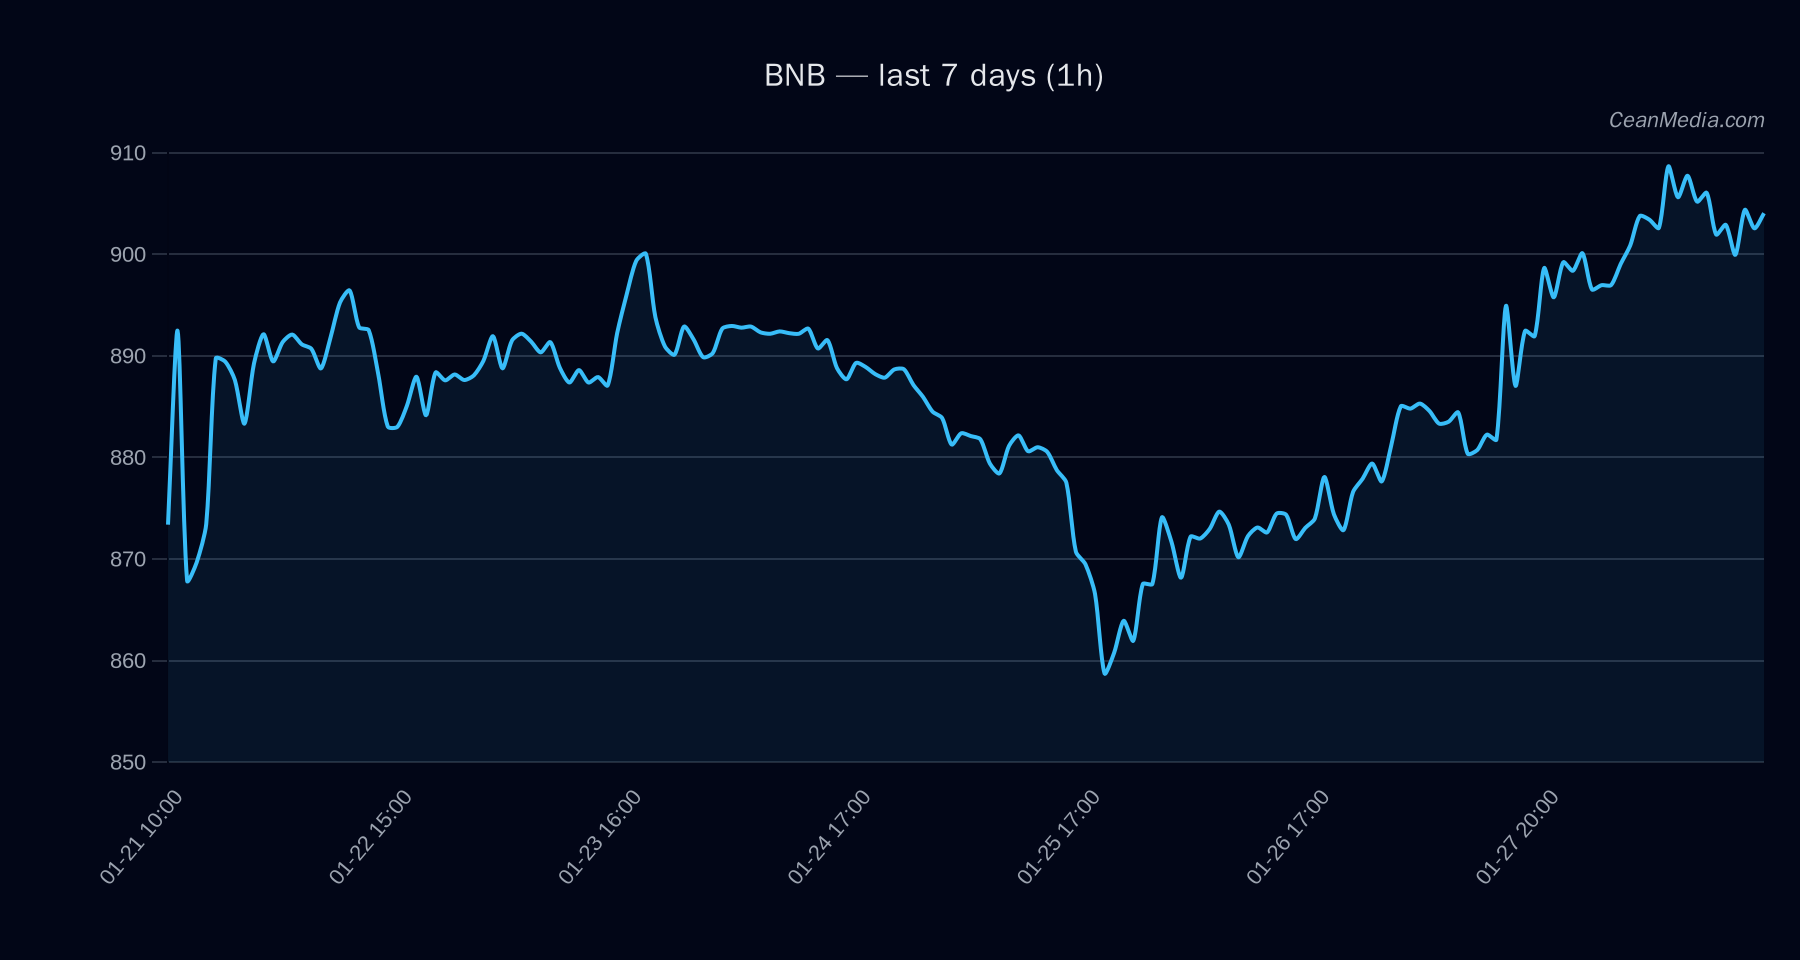
Technical Analysis: BNB
BNB is currently trading between key support at approximately $887 and resistance near $923. The technical indicators suggest a bullish bias:
- EMA12 is above EMA26, indicating upward momentum.
- SMA50 remains above SMA200, supporting a longer-term bullish trend.
- RSI at 58 indicates neutral to slightly bullish momentum.
- Volatility over the past 24 hours remains very low, suggesting a consolidation phase.
If BNB breaks above the resistance at $923, the next upside target is around $941 to $960. Conversely, a decline below support at $887 could see prices test lower levels near $869 to $851. The current forecast favors upward movement with a probability of approximately 52%, contingent on holding above critical support levels.
Drivers
The top factors influencing BNB include:
- 24-hour return of 0.01%, indicating stability.
- EMA slope remains positive at 0.0002, supporting upward momentum.
- Funding Z-Score is neutral at 0.33, suggesting balanced market sentiment.
- Basis Z-Score at 0.75 shows moderate positive bias.
- Order-book imbalance is slightly negative, indicating some selling pressure.
- Bitcoin’s 24-hour return also remains flat at 0.01%, with a trend strength of approximately 0.53, aligning with BNB’s technical outlook.
Overall, momentum remains modest but supportive of a potential upward move, with low volatility indicating consolidation.
ETF Flows (BTC/ETH)
Recent ETF flow data for Bitcoin and Ethereum provide a broader market context. Bitcoin ETFs have experienced consistent outflows, totaling approximately $584.6 million over the last 10 days, which may reflect risk-off sentiment. Conversely, ETH ETFs have seen slight inflows over the past five days, totaling +$40.8 million, indicating some relative risk appetite.
It is important to note that ETF flows for BTC and ETH are only part of the broader market environment and do not directly dictate BNB’s price action. However, persistent outflows from Bitcoin ETFs could suggest caution among investors, potentially impacting risk assets like BNB in the near term.
What to Watch Next
- Monitor BNB’s price action around key support ($887) and resistance ($923) levels for potential breakouts or breakdowns.
- Observe broader market risk sentiment indicated by ETF flows, especially continued Bitcoin outflows.
- Watch for changes in technical momentum indicators, such as RSI and EMA slopes, for early signals of trend reversal.
- Stay alert to macroeconomic developments that could influence risk appetite and crypto flows.
Hashtags: #BNB #CryptoAnalysis #MarketUpdate #TechnicalAnalysis #ETFFlows #Bitcoin #Ethereum #Altcoins #CryptoTrends #RiskOnOff #CryptoNews