Market Snapshot
As of January 31, 2026, Solana (SOL) is trading around the $103.61 level, with a short-term forecast indicating a slight upward bias at approximately 47%. The broader market sentiment remains cautious, with volatility measured at 2.60% and the crypto Fear & Greed Index at Extreme Fear levels. Bitcoin and Ethereum ETF flows suggest a mixed risk appetite among institutional investors, which provides additional context for SOL’s near-term outlook.
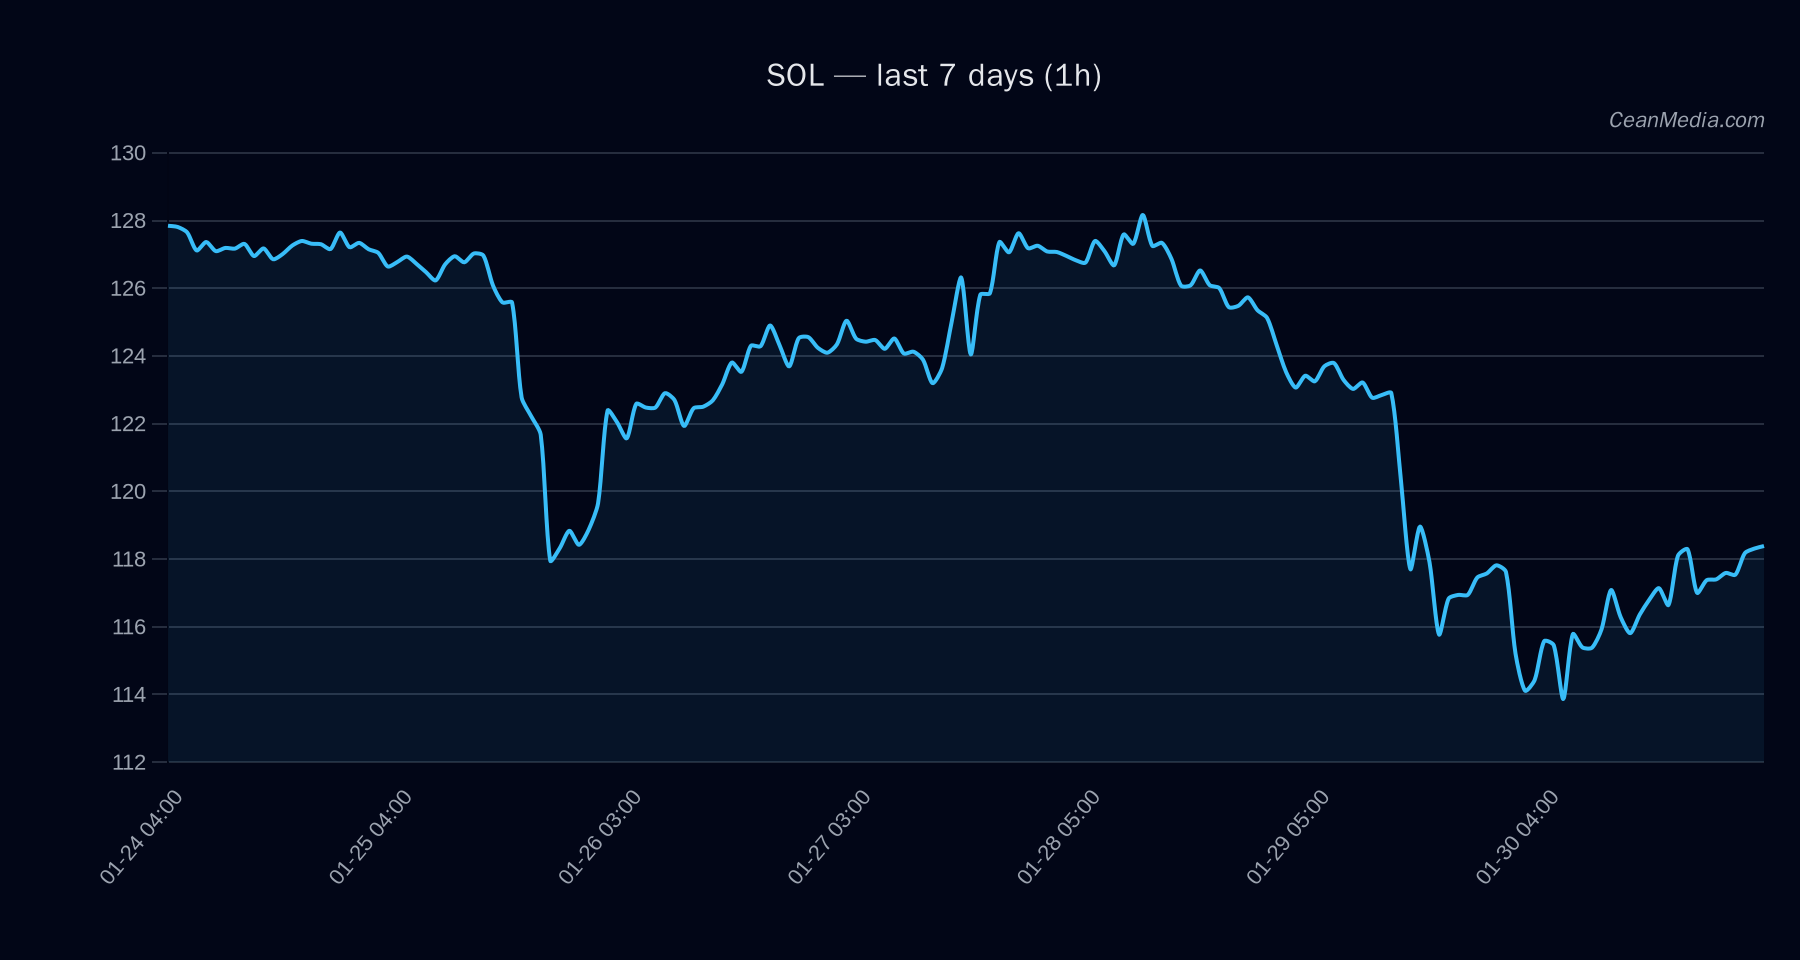
Technical Analysis: SOL
Solana currently sits between key support at $102 and resistance at $106. A decisive break above $106 could target levels around $108–$110, while falling below support at $102 might see a decline towards $97–$99. The technical indicators depict a bearish bias:
- EMA12 is below EMA26, indicating short-term downward momentum.
- SMA50 is below SMA200, confirming a longer-term bearish trend.
- RSI at 18 suggests the asset is oversold, potentially setting the stage for a bounce or consolidation.
> The probability of upward movement within the next 24 hours is approximately 47%, with the downside risk slightly higher at 44%.
Drivers
Key factors influencing SOL include:
- 24H return remains minimal at 0.03%, reflecting subdued momentum.
- EMA slope is marginally positive at 0.0012, indicating slight upward trend strength.
- Funding Z-Score (-0.27) and Basis Z-Score (-1.03) suggest market neutrality but with potential for short-term volatility.
- Order-book imbalance (EMA5) is negative at -0.0063, hinting at slight selling pressure.
- Bitcoin’s 24H return at 0.02% and trend strength at 0.86 support a stable macro environment.
> Overall, momentum remains cautious with no clear breakout signals.
ETF Flows (BTC/ETH)
Recent ETF flow data indicates a risk-on/off environment:
- Bitcoin ETFs have seen a 1-day inflow of +$15.6M, but over 5 and 10 days, outflows dominate at -$527.6M and -$1.87B respectively, suggesting waning institutional interest.
- Ethereum ETFs have experienced consistent outflows over 1, 5, and 10 days, totaling -$96.9M, -$80.4M, and -$381.7M, indicating risk-off sentiment among traders.
> While these flows are only for BTC and ETH, they provide contextual insight into the broader risk appetite, which could influence SOL’s near-term performance.
What to Watch Next
- Monitor SOL’s ability to sustain above $102 support for potential short-term bounce.
- Watch for a breakout above $106 resistance to confirm bullish momentum.
- Observe overall market sentiment shifts, especially in Bitcoin and Ethereum ETF flows, as indicators of broader risk appetite.
- Keep an eye on RSI levels and volume for signs of potential trend reversals or acceleration.
Note: ETF flows are only for BTC and ETH and serve as macro risk context rather than direct signals for SOL.
Hashtags: #Solana #CryptoAnalysis #MarketUpdate #TradingStrategy #Bitcoin #Ethereum #ETFFlows #TechnicalAnalysis #CryptoTrends #Blockchain #Altcoins #MarketSentiment