
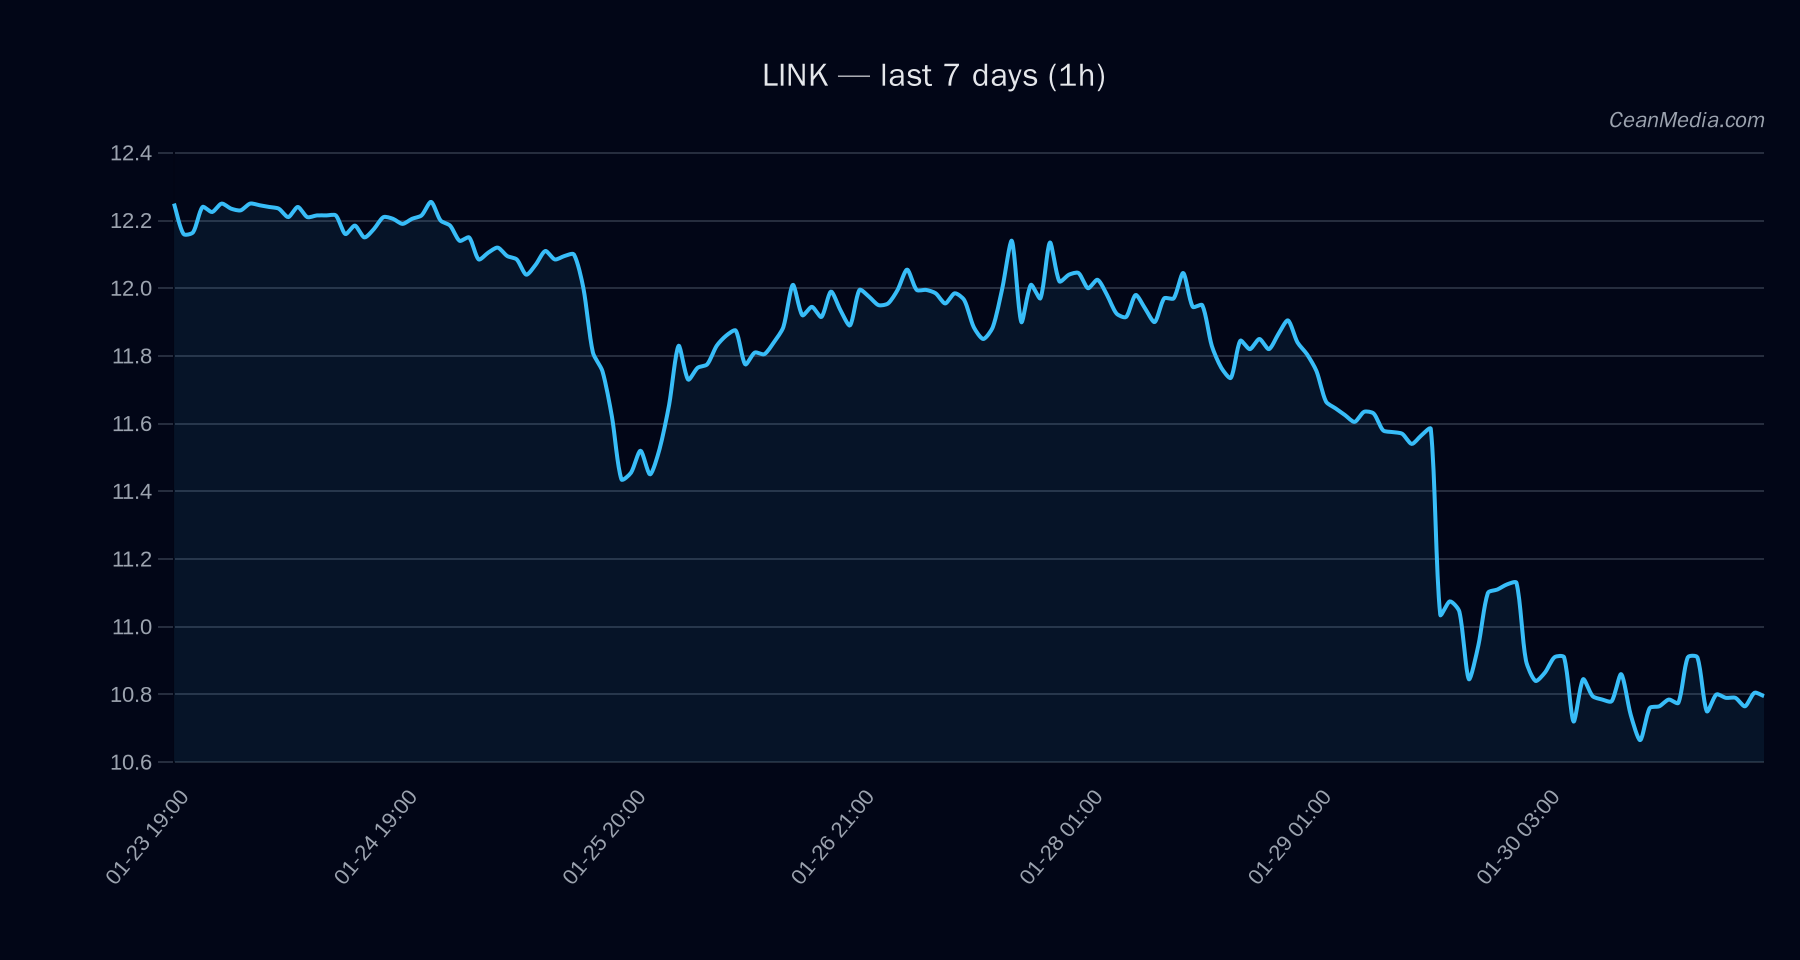
Market Snapshot
As of February 2, 2026, LINK is trading around $9.44, with a short-term bearish bias indicated by technical signals. The broader market exhibits signs of risk aversion, with ETF flows showing significant outflows from Bitcoin and Ethereum ETFs over recent days. The overall sentiment remains cautious amidst volatile conditions.
Technical Analysis: LINK
LINK is currently situated between key support at approximately $9.26 and resistance at around $9.62. A break above the resistance at $9.62 could trigger an upward move towards $9.82 to $10.03. Conversely, a decline below support at $9.26 may lead to further downside to roughly $8.85. The current technical setup is bearish, with EMA12 below EMA26, SMA50 below SMA200, and RSI at an oversold level of 15, indicating potential for short-term downside but also oversold conditions that could precede a bounce. The immediate bias favors a downward move unless key resistance levels are reclaimed.
Drivers
- Return 24H: Slight negative at -0.0042, indicating minimal price momentum.
- EMA Slope: Slightly negative, reinforcing bearish momentum.
- Funding Z-Score: Slightly above neutral at 1.05, suggesting modest funding pressure.
- Basis Z-Score: Negative at -1.62, indicating potential downside risk.
- Order Book Imbalance (EMA5): Slightly negative at -0.05, hinting at selling pressure.
- BTC Return 24H: Slight positive at 0.02, but not significantly impacting LINK directly.
- Market Volatility Regime: Normal, with no extreme volatility signals currently.
- Market Sentiment: Fear index (F&G) at 14 suggests extreme fear, contributing to cautious trading environment.
ETF Flows (BTC/ETH)
Recent ETF data shows significant outflows: Bitcoin ETFs have seen daily outflows of approximately $509.7 million, with total outflows over the past 10 days reaching around $2.39 billion. Ethereum ETFs have experienced similar declines, with daily outflows of about $264.2 million. These flows indicate a risk-off environment, with investors pulling funds from major crypto assets. While this context influences overall market sentiment, it is important to note that ETF flows for BTC and ETH are only peripheral indicators for LINK, which remains primarily driven by its technical setup and broader crypto market conditions.
What to Watch Next
- Monitor if LINK breaks above resistance at $9.62 for confirmation of a potential reversal.
- Watch for a decline below support at $9.26, which could accelerate downside momentum.
- Observe broader market sentiment and ETF flows for signs of risk appetite or aversion.
- Keep an eye on macroeconomic developments and their impact on crypto liquidity and investor behavior.
Hashtags: #LINK #CryptoAnalysis #TechnicalAnalysis #MarketSentiment #ETFFlows #Bitcoin #Ethereum #Altcoins #CryptoTrading #MarketOutlook #RiskOn #RiskOff