Market Snapshot
As of February 3, 2026, Solana (SOL) is trading around $102.74, with a short-term bias leaning towards upward movement, supported by a 47% probability of price appreciation. Broader market sentiment remains cautious, with extreme fear indicated by F&G at 17. The cryptocurrency market continues to experience notable fund outflows from major ETFs, particularly in Bitcoin and Ethereum, reflecting a risk-off environment.
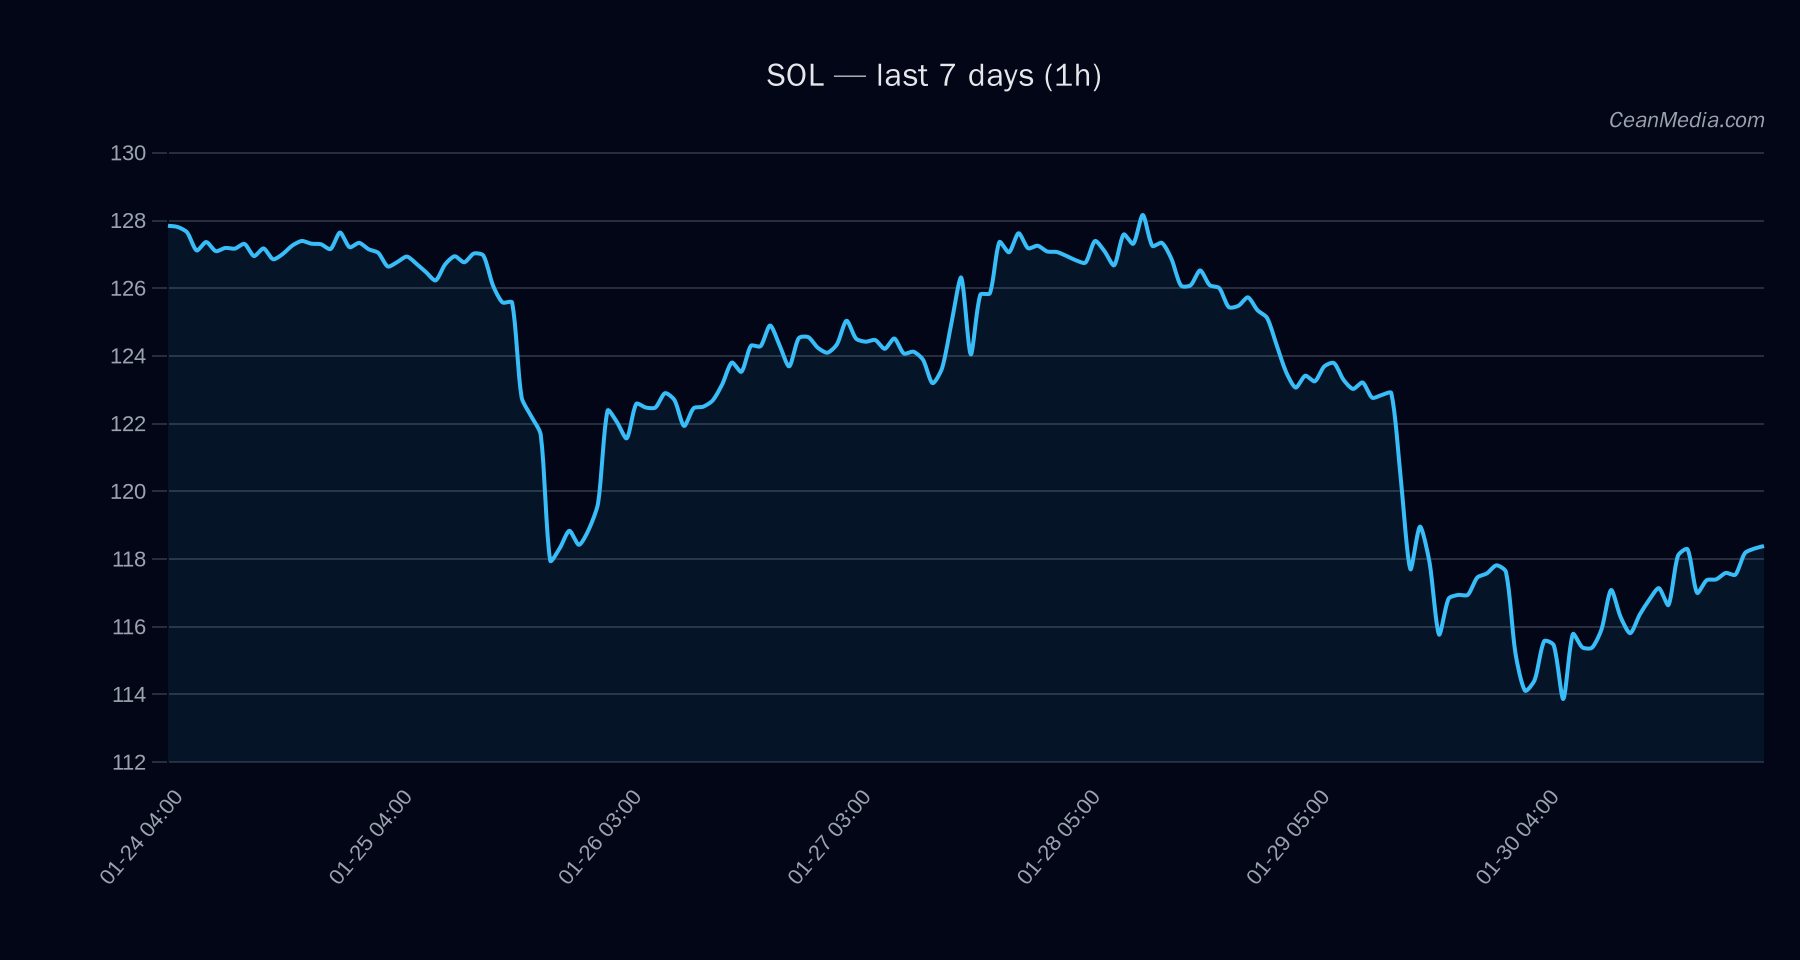
Technical Analysis: SOL
- Levels to Watch: Support at approximately $101 (major support), resistance near $105 (major resistance). Break above $105 could see SOL target between $106.89 and $109.22. Conversely, a break below $101 may lead to a decline towards $98.67 or lower.
- Bias and Indicators: The current technical setup is bearish, with EMA12 below EMA26, SMA50 below SMA200, and an RSI at 18 indicating oversold conditions. The volatility regime is normal, and the 24-hour standard deviation is 2.74%, supporting a sideways to mildly bullish outlook if key levels are breached.
- Triggers and Invalidation: A close above $105 would signal a potential shift towards bullish momentum, while a close below $101 would reinforce downside risk.
Drivers
- Top Factors: 24H return at 0.03%, EMA slope at 0.0012 indicating slight upward momentum, and a BTC return of 0.02% providing some market correlation.
- Market Sentiment & Volatility: Funding Z-Score at -0.27 and Basis Z-Score at -1.03 suggest subdued funding conditions. The order-book imbalance remains slightly negative, indicating some selling pressure. Trend strength remains moderate at 0.86, with a notable correlation to Bitcoin’s 72-hour price movement (ρ=0.95).
- Volatility & Momentum: The 7-day return volatility (RV) is around 3.27%, with a trend strength slightly above 1, indicating cautious but stable momentum.
ETF Flows (BTC/ETH)
Recent ETF data shows significant outflows in Bitcoin and Ethereum, with daily declines of approximately $509.7 million and $264.2 million respectively. Over the past 5 and 10 days, these outflows have accumulated to over $1 billion for BTC and ETH combined, signaling a broader risk-off sentiment. While these flows do not directly impact SOL, they provide context for the current cautious market environment, which may influence altcoin performance.
What to Watch Next
- Monitor SOL’s price action around the key support ($101) and resistance ($105) levels for potential breakout signals.
- Observe broader market sentiment and ETF flows, especially in BTC and ETH, for indications of risk appetite or aversion.
- Keep an eye on technical indicators such as RSI and moving averages for signs of trend reversal or confirmation.
- Watch for any shifts in funding and order-book imbalances that could signal increased selling or buying pressure.
Hashtags: #Solana #CryptoAnalysis #MarketUpdate #TechnicalAnalysis #ETFFlows #CryptoSentiment #Altcoins #BTC #ETH #RiskOn #RiskOff #CryptoTrends