Market Snapshot
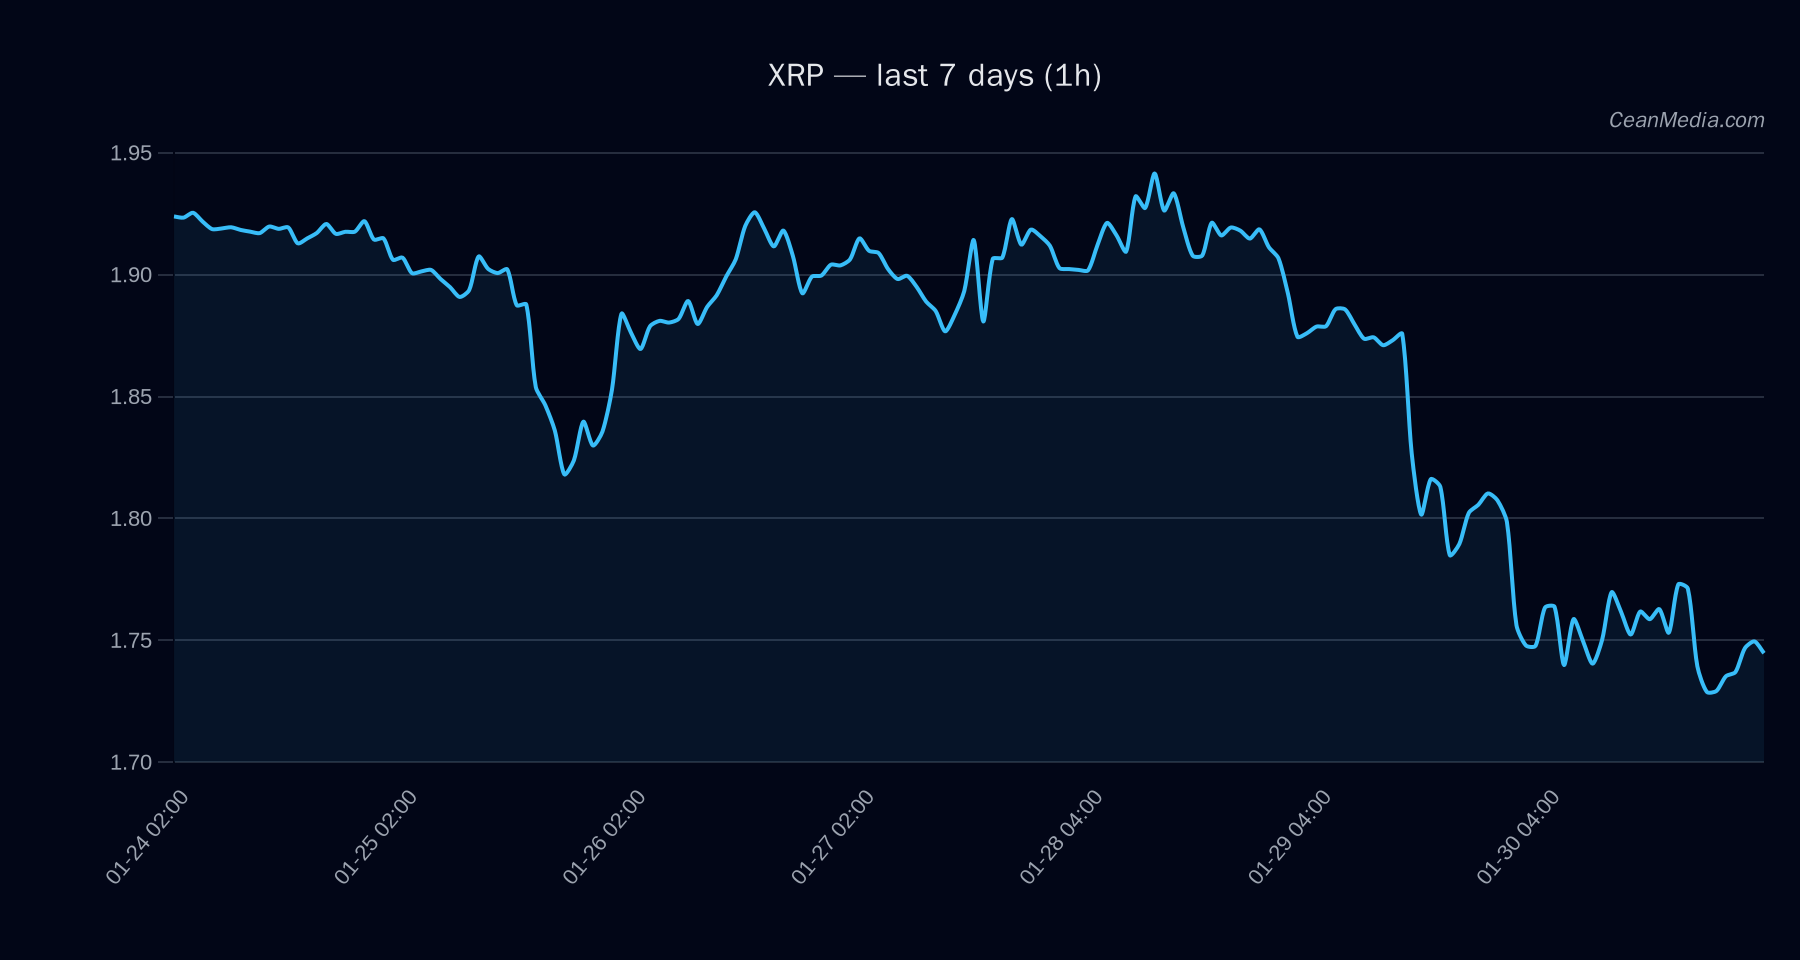
As of February 3, 2026, XRP is trading near key support levels, with a current price of approximately $1.60. Market sentiment remains bearish in the short term, with a 64% probability of downside movement based on recent technical signals. ETF flows in Bitcoin and Ethereum continue to influence broader market dynamics, although they are not direct indicators for XRP.
Technical Analysis: XRP
- Levels to Watch: Support at around $1.56, resistance near $1.64. Break above resistance could target $1.66–1.70, while a break below support may see prices drop toward $1.53–1.50.
- Bias: Bearish, supported by EMA12
- Triggers: A daily close above $1.64 could signal a short-term upward correction, whereas a close below $1.56 would reinforce the bearish outlook.
- Invalidation: A sustained move above $1.88 would invalidate the current bearish bias and suggest potential for recovery.
Drivers
- Top Factors: The 24-hour return remains slightly negative at -0.17%, with the EMA slope also marginally declining. The funding Z-score at -3 indicates heightened bearish sentiment, while the order-book imbalance remains positive at 0.06.
- Market Momentum & Volatility: BTC’s 24-hour return is positive at 2%, with a trend strength of approximately 0.86, suggesting a relatively strong bullish momentum in Bitcoin. Overall, market volatility remains low, supporting a cautious outlook for XRP.
ETF Flows (BTC/ETH)
Recent ETF flow data shows inflows into Bitcoin ETFs (+$419.8M in 1D), but over the past five and ten days, outflows have been significant (-$639.9M and -$1.58B respectively). Ethereum ETFs have experienced positive inflows (+$84.7M in 1D), but also face declines over longer periods. These flows suggest a risk-on environment in crypto markets, primarily driven by Bitcoin and Ethereum, which can indirectly influence XRP sentiment but are not primary signals for XRP itself.
What to Watch Next
- Monitor daily close levels around $1.64 for potential bullish signals.
- Watch for a break below $1.56, which could accelerate downside momentum.
- Keep an eye on Bitcoin and Ethereum ETF flows as a broader market risk indicator.
- Observe RSI movements and volatility shifts for early trend signals.
Hashtags: #Crypto #XRP #MarketAnalysis #TechnicalAnalysis #ETFFlows #Bitcoin #Ethereum #CryptoMarkets #TradingStrategy #MarketSentiment #Altcoins #FinancialAnalysis