Market Snapshot
As of February 4, 2026, Solana (SOL) is trading around $98.61, positioned between key support at $96.6 and resistance at $101. The broader market exhibits signs of fear, with the Crypto Fear & Greed Index at 14, indicating extreme caution among investors. Bitcoin (BTC) and Ethereum (ETH) ETF flows show mixed sentiment, with recent inflows in BTC ETFs suggesting a cautious risk-on environment, albeit with overall net outflows over the past week.
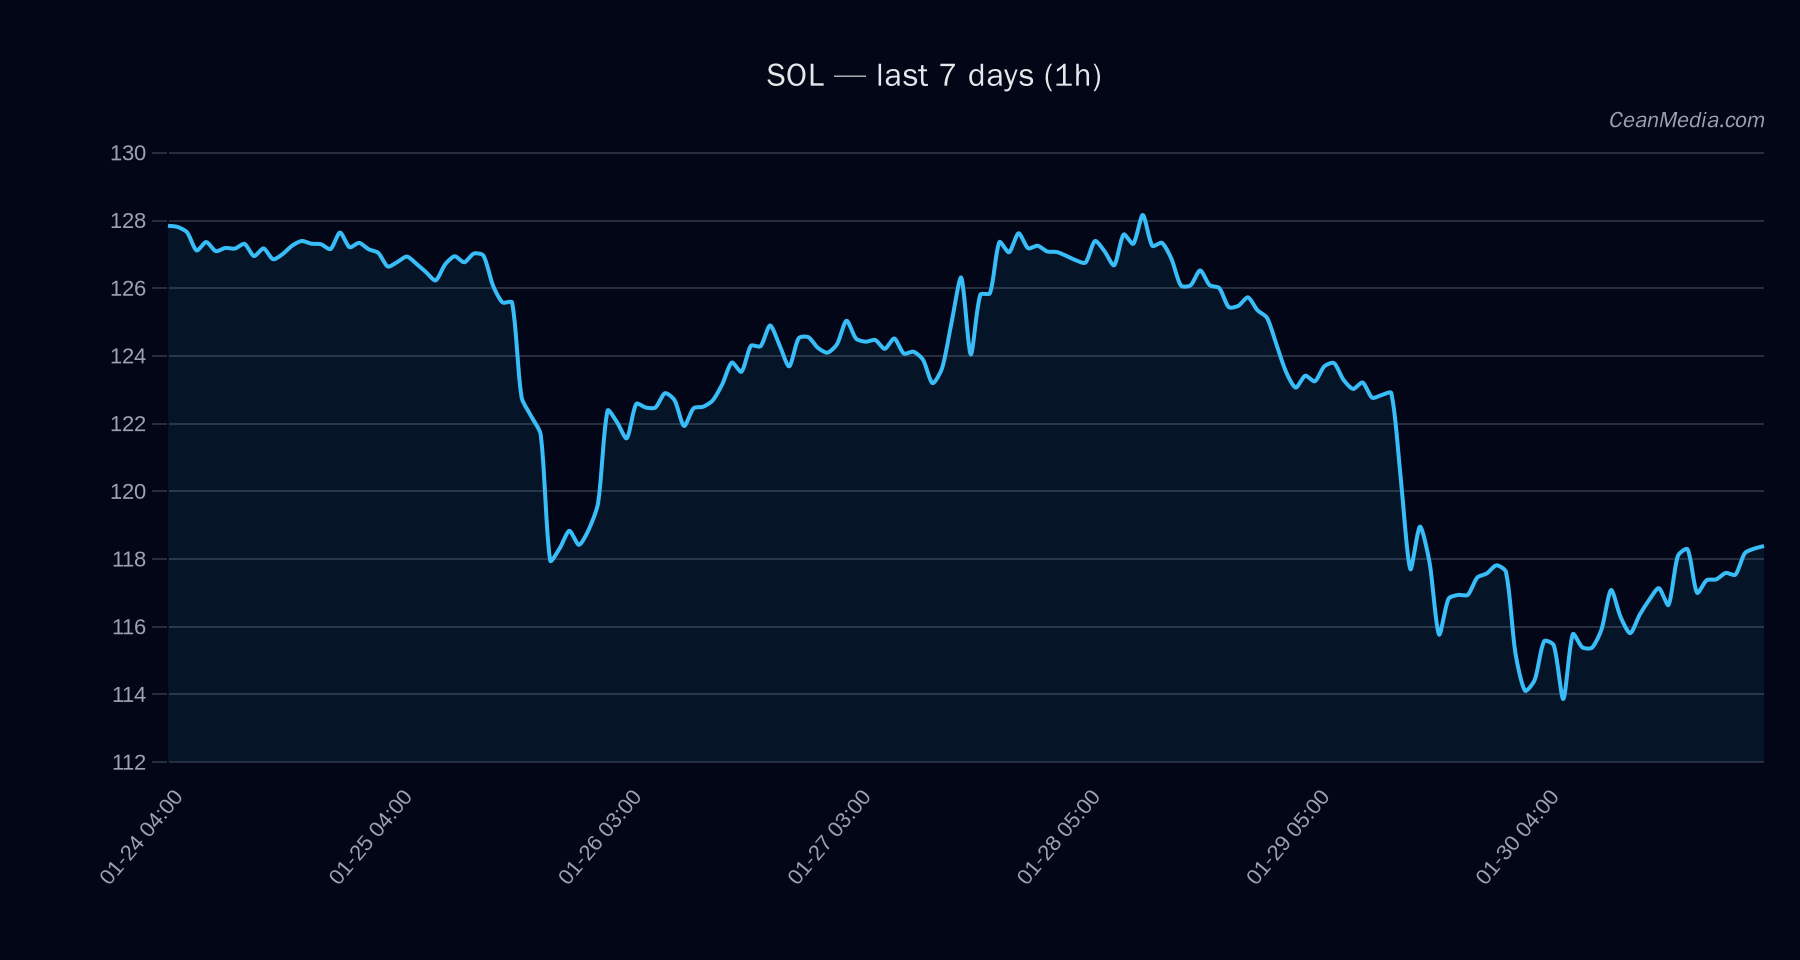
Technical Analysis: SOL
- Levels to Watch: Support at $96.6; Resistance at $101. Break above $101 targets $102.6–$105.4. Break below $96.6 targets $94.7–$91.9.
- Bias: Bearish in the short term, with EMA12 below EMA26 and SMA50 below SMA200. RSI at 15 indicates oversold conditions, suggesting potential for a rebound.
- Triggers: A close above $101 on the 1-hour chart would favor upward momentum, while a close below $96.6 would reinforce downside risk.
- Invalidation: Significant movement above $105.4 or below $91.9 would alter the current bias and require reassessment.
Drivers
- Top Factors: 24-hour return remains minimal at 0.03%, with EMA slope at 0.0012 indicating very mild positive momentum.
- Market Sentiment: Funding Z-Score at -0.27 and Basis Z-Score at -1.03 reflect subdued speculative activity, consistent with risk-off sentiment.
- Volatility & Trend: Normal volatility regime with a trend strength of approximately 0.86, indicating limited directional conviction.
- Bitcoin Influence: BTC’s 24-hour return of 0.02% and trend strength at 0.86 suggest supportive but cautious market conditions for correlated assets.
ETF Flows (BTC/ETH)
Recent ETF data shows inflows into BTC ETFs (+$419.8M in 1D) despite overall outflows over the past week, implying a tentative risk-on shift in Bitcoin markets. Conversely, ETH ETFs have experienced smaller inflows (+$84.7M 1D) but have faced consistent outflows over longer periods. It is important to note that these ETF flows are only for BTC and ETH and serve as contextual indicators; they are not direct signals for SOL’s price movements.
What to Watch Next
- Monitor the 1-hour close relative to $101 and $96.6 for potential breakout or breakdown signals.
- Observe market sentiment indices and ETF flows for signs of risk appetite shifts.
- Watch for any macroeconomic developments or crypto-specific news that could impact liquidity and investor confidence.
- Keep an eye on Bitcoin and Ethereum trends as they often influence Solana’s market direction.
Hashtags: #Solana #CryptoAnalysis #MarketUpdate #Bitcoin #Ethereum #ETFFlows #CryptoTrends #TechnicalAnalysis #CryptoNews #RiskOn #RiskOff #Altcoins