Market Snapshot
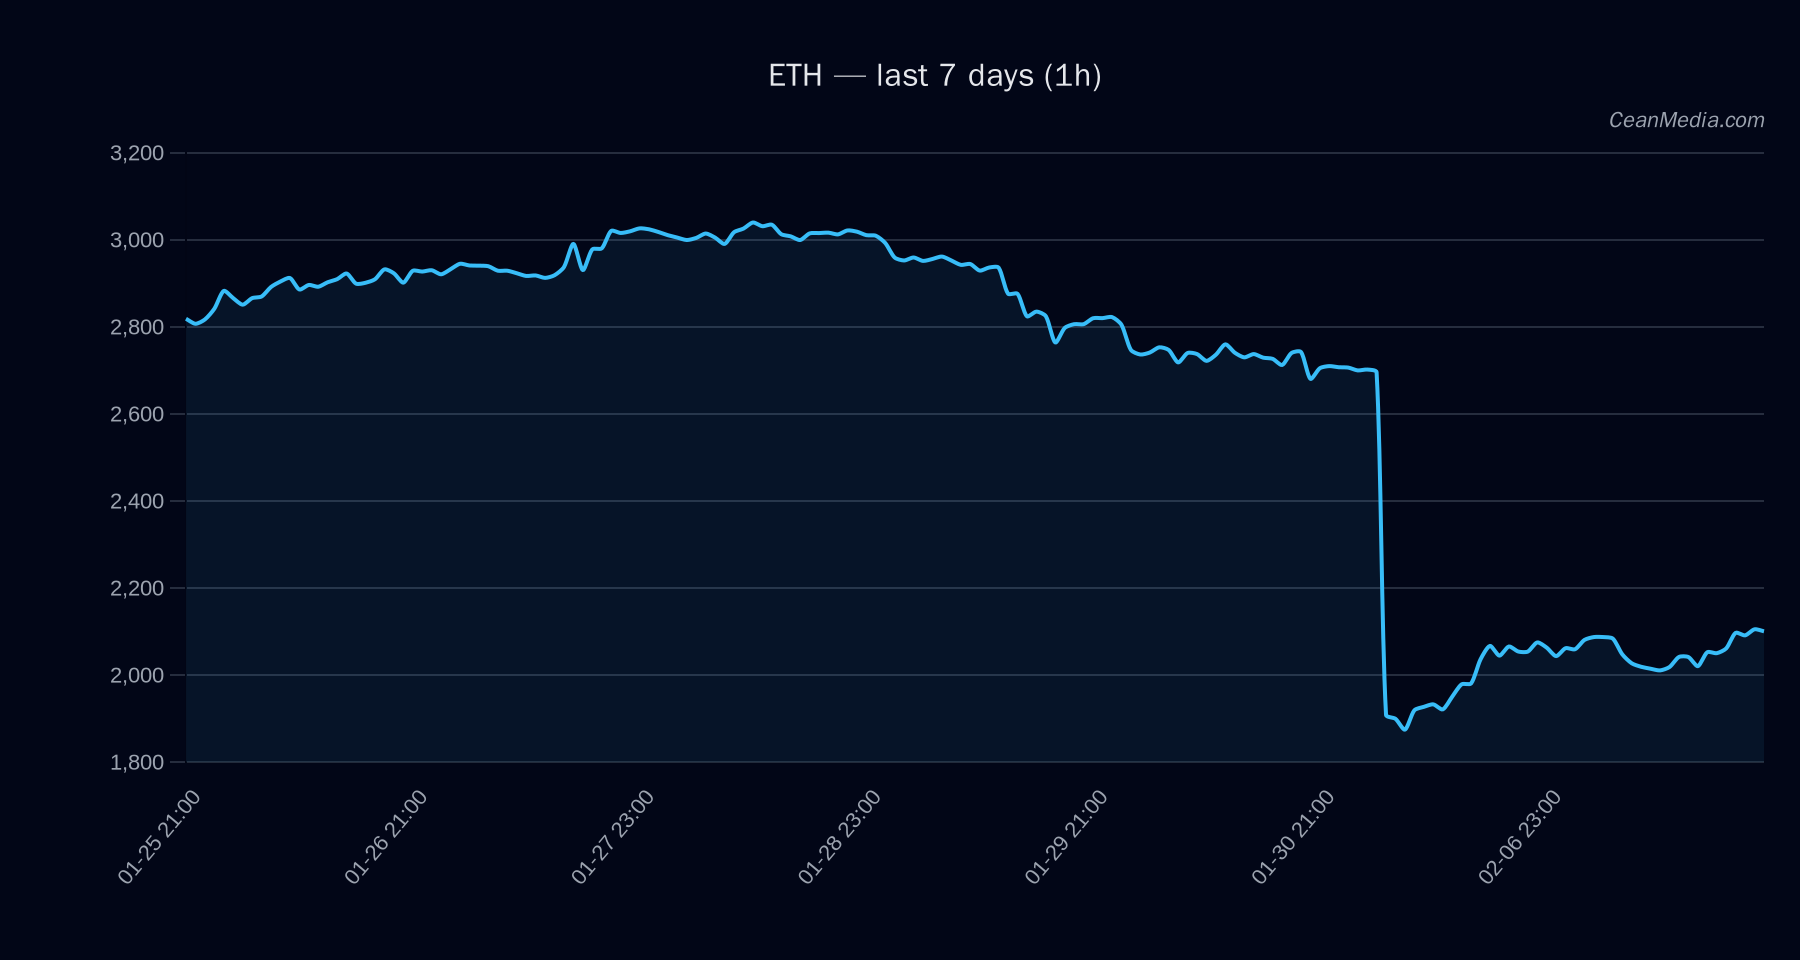
ETH faces a narrow trading range near the 2,054–2,138 zone, with a bearish short-term bias implied by the latest TA. The price sits between a key near-term support and resistance, suggesting a potential breakout trigger if the level at 2,138 is breached to the upside, or a breakdown below 2,054 could open a lower-range scenario.
Technical Analysis: ETH
- Current price: 2,095.54
- Short-Term Forecast: down (49%)
- Probability Mix: Up 41% | Side 10% | Down 49%
- Momentum Cues: EMA12 < EMA26; SMA50 < SMA200; RSI 52; σ24h 0.85%; Volatility regime: Very low
- Support / Resistance: Major Support 2,062; Near Support 2,054; Major Resistance 2,288; Near Resistance 2,138
- Key Triggers: Break above 2,138 → potential move to 2,180.20–2,222.95; Break below 2,054 → potential move to 2,012.56–1,971.48
- Topline Bias: Bearish for the immediate horizon, with a tight range-bound setup unless a breakout occurs.
Drivers
- Return 24H: 0.02%
- EMA Slope: 0.0035
- Funding Z-Score: -0.38
- Basis Z-Score: -0.38
- Order-Book Imbalance (EMA5): 0.14
- BTC Return 24H: -0.0052%
- BTC Vol Regime: 1 (low to moderate implied volatility)
- BTC Trend Strength: 0.13
- Overall Volatility Regime: Very low
- Other contextual factors: F&G (Fear&Greed) at 6 (Extreme Fear); BTC.D 56.6%
ETF Flows (BTC/ETH)
Contextual ETF flow data is provided for BTC and ETH only. It reflects investor inflows/outflows in related products and should be treated as a market backdrop rather than a direct ETH trading signal.
- BTC ETF: +$92.1M (1D); -$425.7M (5D); -$1.48B (10D)
- ETH ETF: +$9.7M (1D); -$38.7M (5D); -$286.4M (10D)
Interpretation: The latest data shows a modest daily inflow for BTC ETFs and a small positive one for ETH ETFs on the 1D frame, with larger outflows evident over a 5D to 10D horizon. This pattern can indicate incremental risk-on/off preferences but is not a primary signal for ETH price action. The flows should be considered as context for broader market sentiment alongside technicals and spot activity.
What to Watch Next
- Watch for a daily close above 2,138 to validate a potential upside extension toward 2,180–2,222.
- Monitor a daily close below 2,054 to confirm a shift toward the 2,012–1,971 area.
- Observe any shifts in BTC vol regime and trend strength, as these can influence ETH correlations in the short term.
- Keep an eye on ETF flow updates, particularly any sustained shifts in BTC/ETH product demand, for additional context (not a primary ETH signal).
Hashtags: #ETHTechnicalAnalysis #ETHForecast #CryptoMarkets #ETFFlows #BTCvsETH #MarketStructure #PriceAction #RiskManagement #CryptoNews #TradingStrategy #TechnicalLevels #MarketSentiment