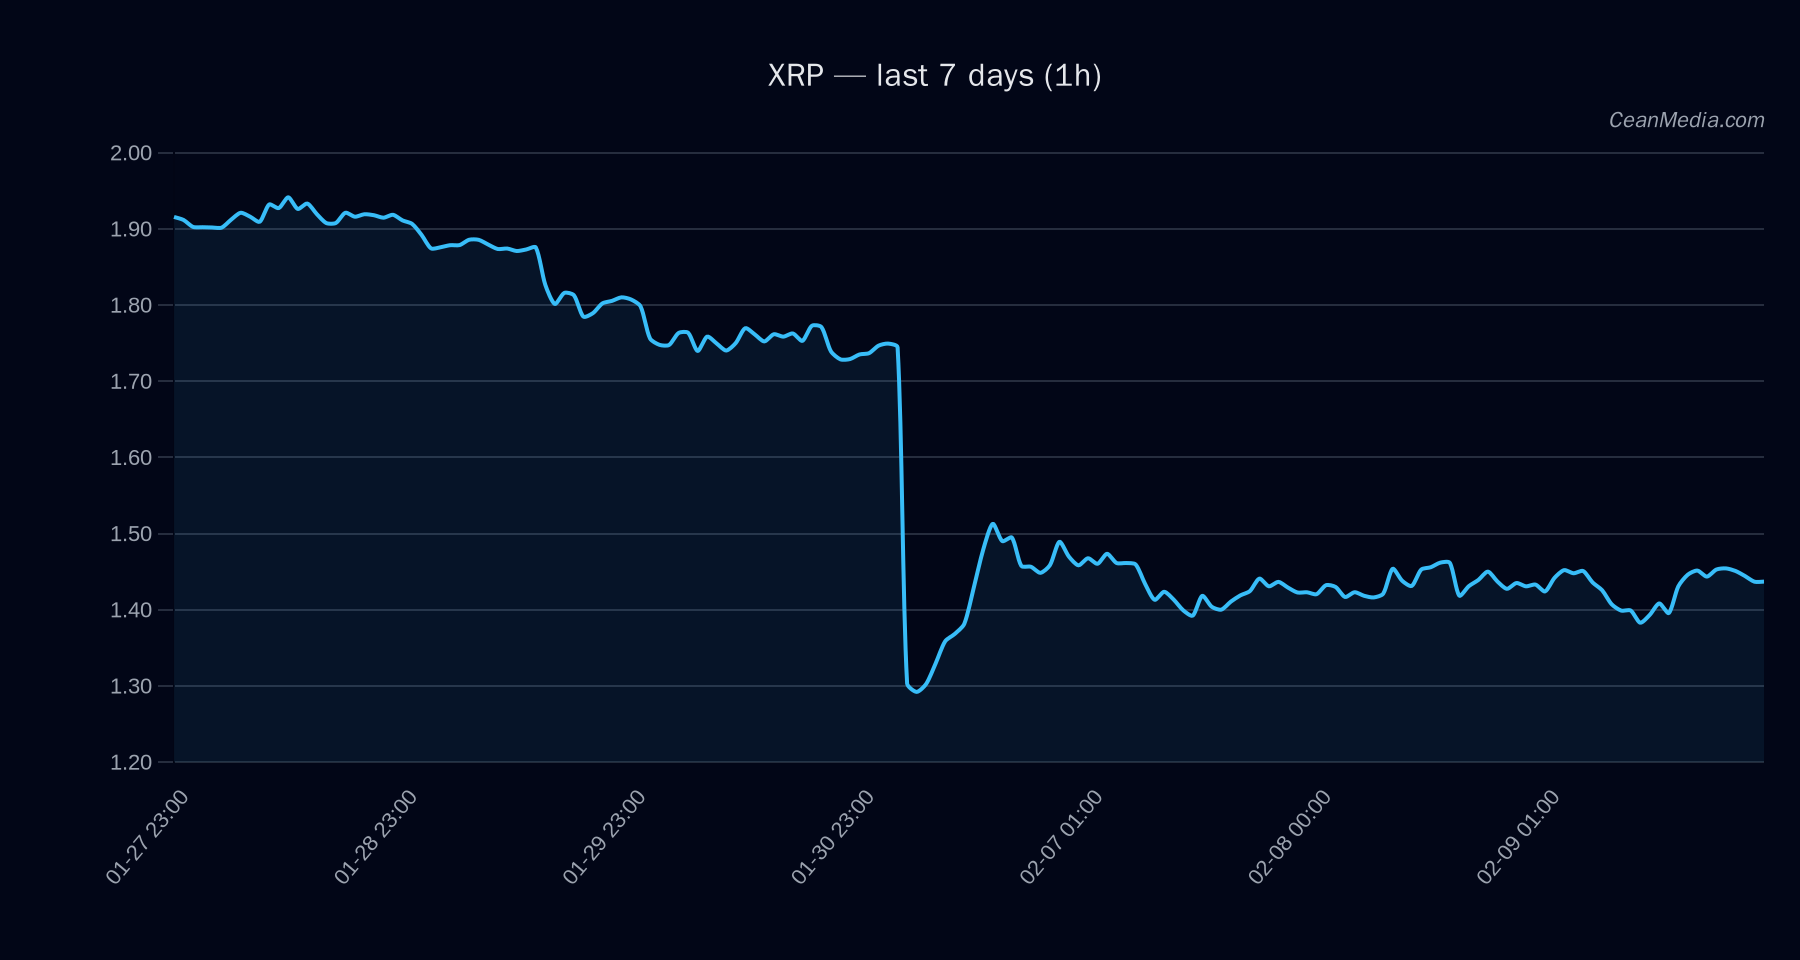
Market Snapshot
Price of XRP at 1.4493 with a short-term forecast skewed to the downside. The immediate range sits between 1.42 and 1.48, with a major resistance near 1.62 and major support near 1.44. Market breadth remains positive but volatility is reported as very low.
Technical Analysis: XRP
- Price: 1.4493
- Short-Term Forecast: down (57%)
- Probabilities: Up 30%, Sideways 12%, Down 57%
- Moving Averages: EMA12 > EMA26, SMA50 < SMA200
- RSI: 55 (neutral)
- Volatility Regime: Very low (σ24h 0.90%)
- Band (P20–P80): 1.3911 – 1.488
Key levels:
- Support (Major): 1.44
- Support (Near): 1.42
- Resistance (Near): 1.48
- Resistance (Major): 1.62
Trends & Bias: The price is trading within a range defined by 1.42–1.48 with a bias to the downside on a 24-hour horizon. A close above 1.48 would open a path toward 1.5079–1.5374. A break below 1.42 would target 1.3919–1.3635.
Traders’ note: The forecast incorporates intraday drivers such as order-book imbalance (EMA5), momentum signals, and BTC-related indicators, but the overall bias remains modestly bearish in the near term unless new highs are breached.
Drivers
- Return 24H: +0.27%
- EMA Slope: bearish (-0.00014)
- Funding Z-Score: -0.97
- Basis Z-Score: -0.55
- Order-Book Imbalance (EMA5): +0.058
- BTC Return 24H: -0.955%
- BTC Vol Regime: 0
- BTC Trend Strength: 0.322
The top drivers indicate a modest negative tilt from on-chain and cross-asset momentum, with limited BTC-driven volatility under current conditions. The volatility regime is described as very low, contributing to range-bound behavior.
ETF Flows (BTC/ETH)
Note: ETF flow data presented here pertains to BTC and ETH only and provides context but is not a primary signal for XRP. The BTC ETF shows a strong 1D inflow of +$371.1M, with 5D and 10D trends negative (-$146.7M and -$1.20B respectively). The ETH ETF shows a 1D outflow of -$28.6M, with continued negative flow over 5D (-$77.0M) and 10D (-$324.7M). These flows suggest shifting risk appetite and intraday liquidity dynamics in BTC/ETH markets, which may influence ETH/BTC correlations and broader market sentiment, but XRP is not directly driven by these ETF numbers.
What to Watch Next
- Monitor a daily close above 1.48 to validate a bullish breakout pathway toward 1.5079–1.5374.
- Watch for a daily close below 1.42 to confirm downside exposure toward 1.3919–1.3635.
- Keep an eye on BTC price action and BTC.D shifts, as broad-market risk-on/off can spill into XRP’s volatility regime.
- Note changes in volatility: a move from very low to higher volatility could precede a breakout or breakdown.
Hashtags: #XRP #CryptoAnalysis #MarketSnapshot #TechnicalAnalysis #ETFFlows #BTC #ETH #AltMarket #CryptoNews