Market Snapshot
BNB is trading around the 605–630 zone with near-term downside bias as of 2026-02-10. The price sits between support at 605 and resistance at 630, with a break above 630 potentially signaling a move toward 642.46–655.05. A break below 605 would open a path toward 593.06–580.95. Market breadth indicators remain weak, and volatility is described as very low.
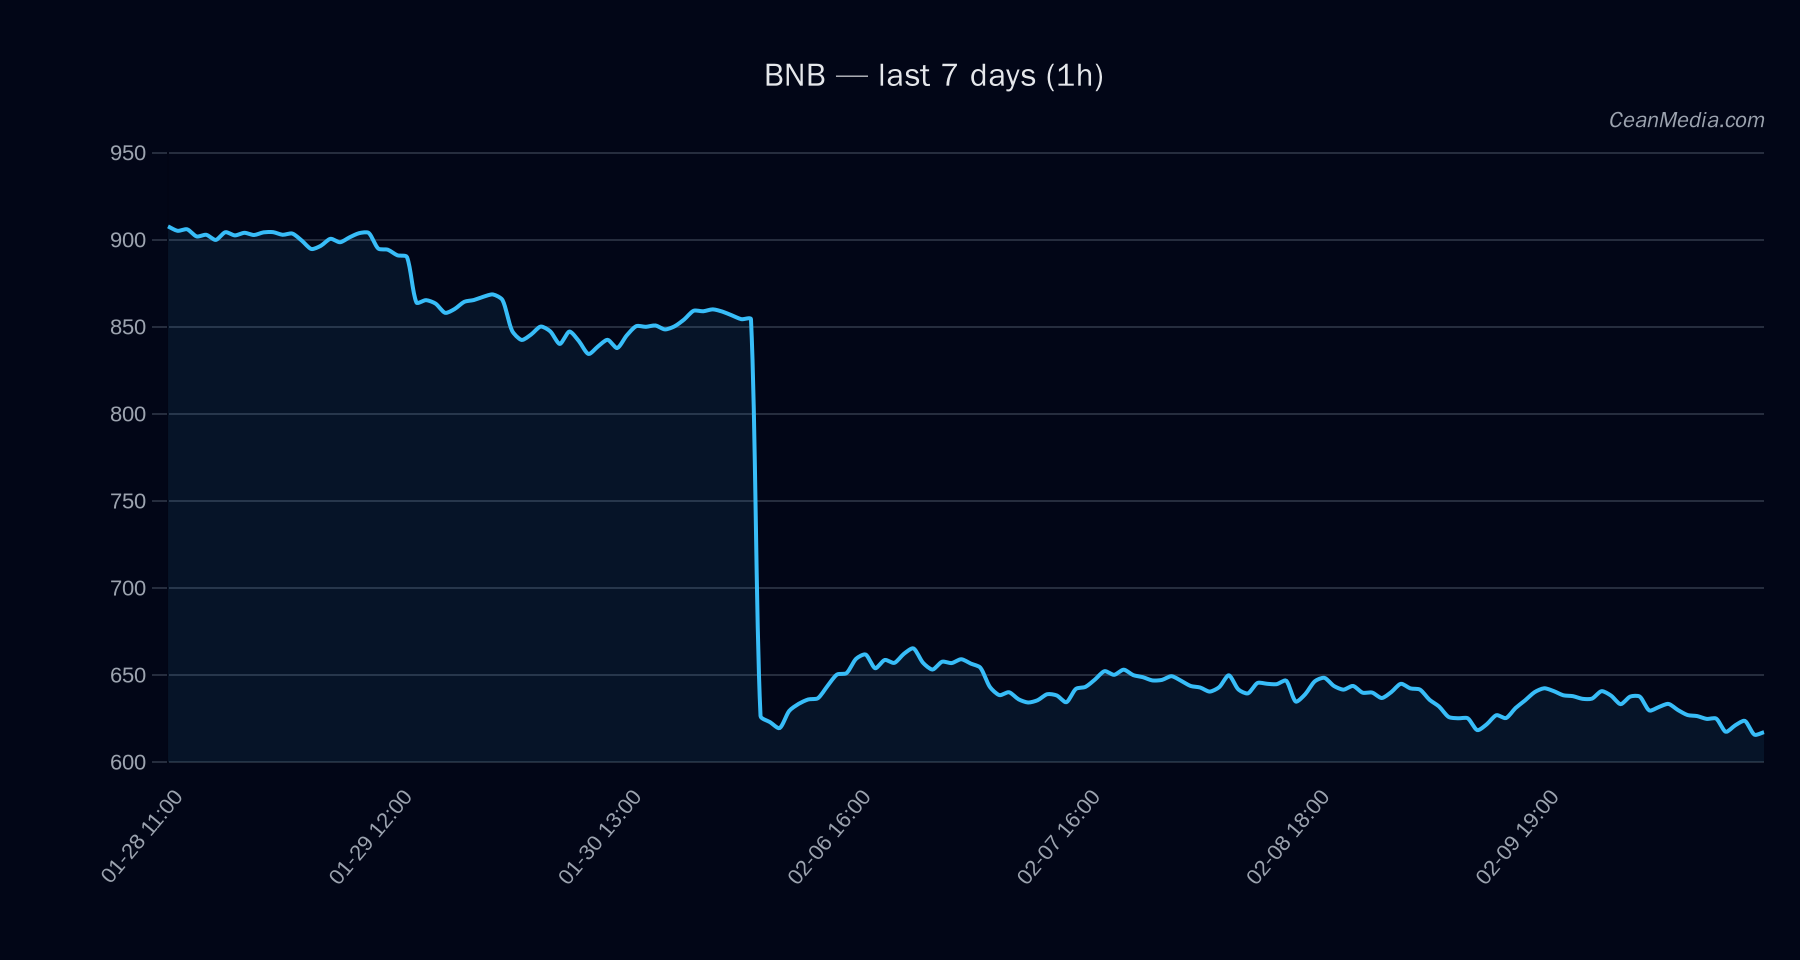
Technical Analysis: BNB
- Current price (approx): 617.51
- Bias: Downward (Short-Term Forecast: down 47%)
- Key indicators: EMA12 < EMA26, SMA50 < SMA200; RSI 37; 24h volatility 0.56%; Vol regime: Very low
- Support / Resistance: Major support 605; Near support 605; Major resistance 665; Near resistance 630
- Projected levels (upside trigger): 1h close > 630 → 642.46 – 655.05
- Projected levels (downside trigger): 1h close < 605 → 593.06 – 580.95
- Forecast: Bearish with probability 46.7% for the downside, 40.4% for upside, 12.9% sideways (as of the provided forecast)
- Price band (P20–P80): 605.04 – 625.39; P50: 616.16
- Momentum/volatility signals: RSI neutral (37); very low volatility regime; EMA slope negative; funding and basis z-scores negative (−0.98 and −3.10 respectively), indicating cautious sentiment.
Drivers
- Return 24H: −0.04
- EMA slope: −0.0026
- Funding z-score: −0.98
- Basis z-score: −3.10
- Order-book imbalance (EMA5): −0.10
- BTC return 24H: −0.02
- BTC volatility regime: 0
- BTC trend strength: 0.68
ETF Flows (BTC/ETH)
Contextual data indicates mixed flow signals in BTC and ETH ETFs, which can influence risk sentiment broadly but are not primary signals for BNB pricing. The BTC ETF shows +$165.8M in the last 24 hours, with larger negative flows over 5 and 10 days (−$400.7M and −$1.04B, respectively). ETH ETF shows +$102.0M in the last 24 hours, with −$59.7M (5D) and −$342.2M (10D). Such patterns may reflect short-term risk-on/off appetite but should be weighed against asset-specific technicals for BNB.
What to Watch Next
- Watch for a close above 630 to validate near-term upside towards 642.46–655.05.
- Monitor a break below 605 as a potential signal toward 593.06–580.95.
- Keep an eye on BTC/ETH ETF flow shifts as a contextual risk-on/off indicator, not a primary driver for BNB.
- Observe changes in RSI and EMA/SMA crossovers for any shift in momentum, given the current very low volatility regime.
Hashtags: #BNBAnalysis #CryptoTechnicals #MarketOutlook #ETFFlows #BTC #ETH #CryptoNews #PriceUpdate #RiskManagement #TradingStrategy #MarketSentiment