Market Snapshot
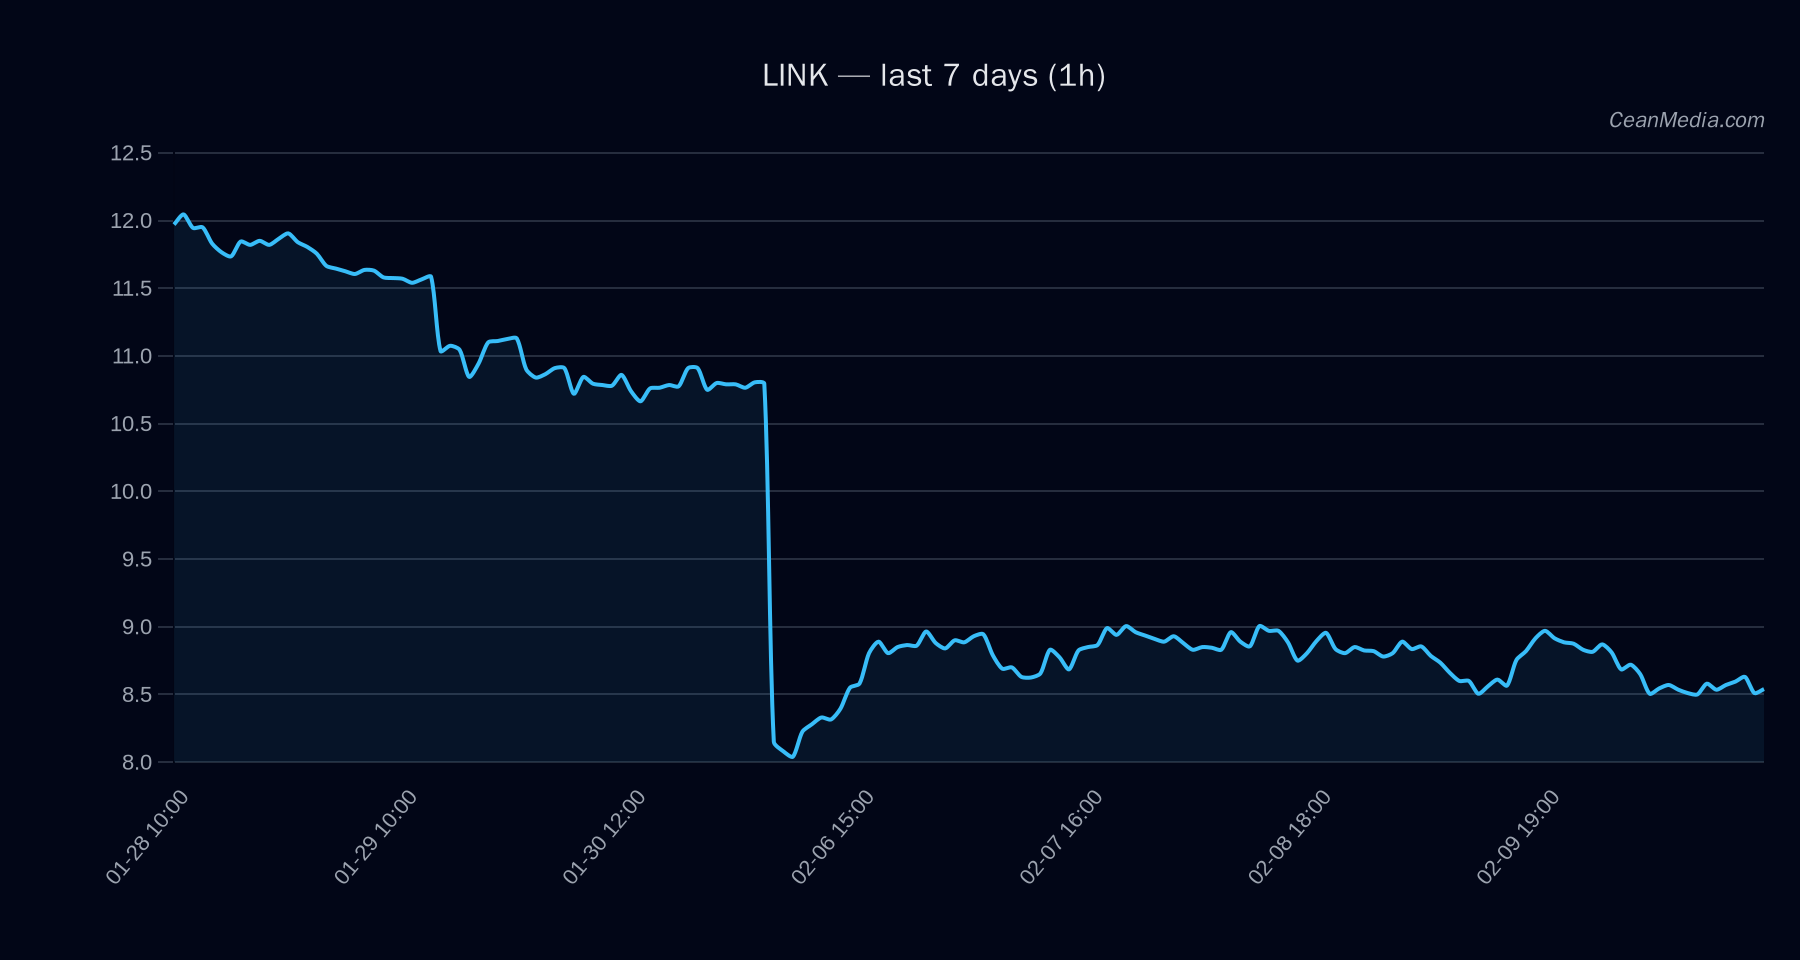
Price: 8.49. The immediate near-term bias for LINK is bearish with a 50% probability of a downside move over the next 24 hours, and a 35% probability of an upside move. The RSI sits at 39, indicating neutral-to-bearish momentum. The observed technical configuration shows EMA12 < EMA26 and SMA50 < SMA200, with a very low volatility regime and a recent pullback from the intraday high. Key bands and levels: P20–P80 is 8.2478–8.8719; major support at 8.66 (near 8.32); major resistance at 9.3 (near 8.66).
Technical Analysis: LINK
- Current price: 8.49
- Trend/Bias: Downward bias (Forecast: down 50%).
- Key indicators: EMA12 < EMA26; SMA50 < SMA200; RSI 39; Volatility: Very low; σ24h 0.67%
- Support / Resistance: Major support 8.66, near support 8.32; Major resistance 9.3, near resistance 8.66
- Breakout scenarios: Break above 8.66 targets 8.833–9.0062; Break below 8.32 targets 8.1538–7.9874
- Recommended action framework: Monitor for a close above 8.66 for a potential short-term upside; monitor for a close below 8.32 for a potential downside confirmation.
- Contextual notes: Breadth > 50h: 0%; BTC correlation (72h): -0.15; F&G: 9 (Extreme Fear); BTC.D ~57.0%.
Drivers
- Return 24H: -0.05
- EMA slope: -0.0008
- Funding Z-Score: 1.41
- Basis Z-Score: -0.93
- Order-book imbalance (EMA5): -0.01
- BTC Return 24H: -0.03
- BTC Vol Regime: 0
- BTC Trend Strength: 0.87
ETF Flows (BTC/ETH)
Context: ETF flow data provided is limited to BTC and ETH. Current readings show BTC ETFs: +$165.8M in the last 1D, but -$400.7M over 5D and -$1.04B over 10D; ETH ETFs: +$102.0M in the last 1D, -$59.7M over 5D, -$342.2M over 10D. These figures describe liquidity shifts in BTC/ETH ETF instruments and should be viewed as contextual background rather than primary signal for LINK price action. The data can reflect risk-on or risk-off momentum, but does not directly imply LINK moves.
What to Watch Next
- Watch for a daily close above 8.66 to validate a potential near-term upside path towards 8.83–9.01.
- Monitor a daily close below 8.32 to confirm renewed downside momentum toward 8.15–7.99.
- Keep an eye on overall market risk sentiment as quantified by BTC/ETH ETF flows, recognizing this is contextual rather than a LINK-specific signal.
- Observe RSI movement around 39–40; any sustained move above 45 could shift bias toward neutral or bullish, depending on price action and vol regime.
Hashtags: #LINK #CryptoAnalysis #TechnicalAnalysis #ETFFlows #BTC #ETH #MarketSnapshot #PriceAction #RiskManagement #CryptoMarkets #TradingStrategy