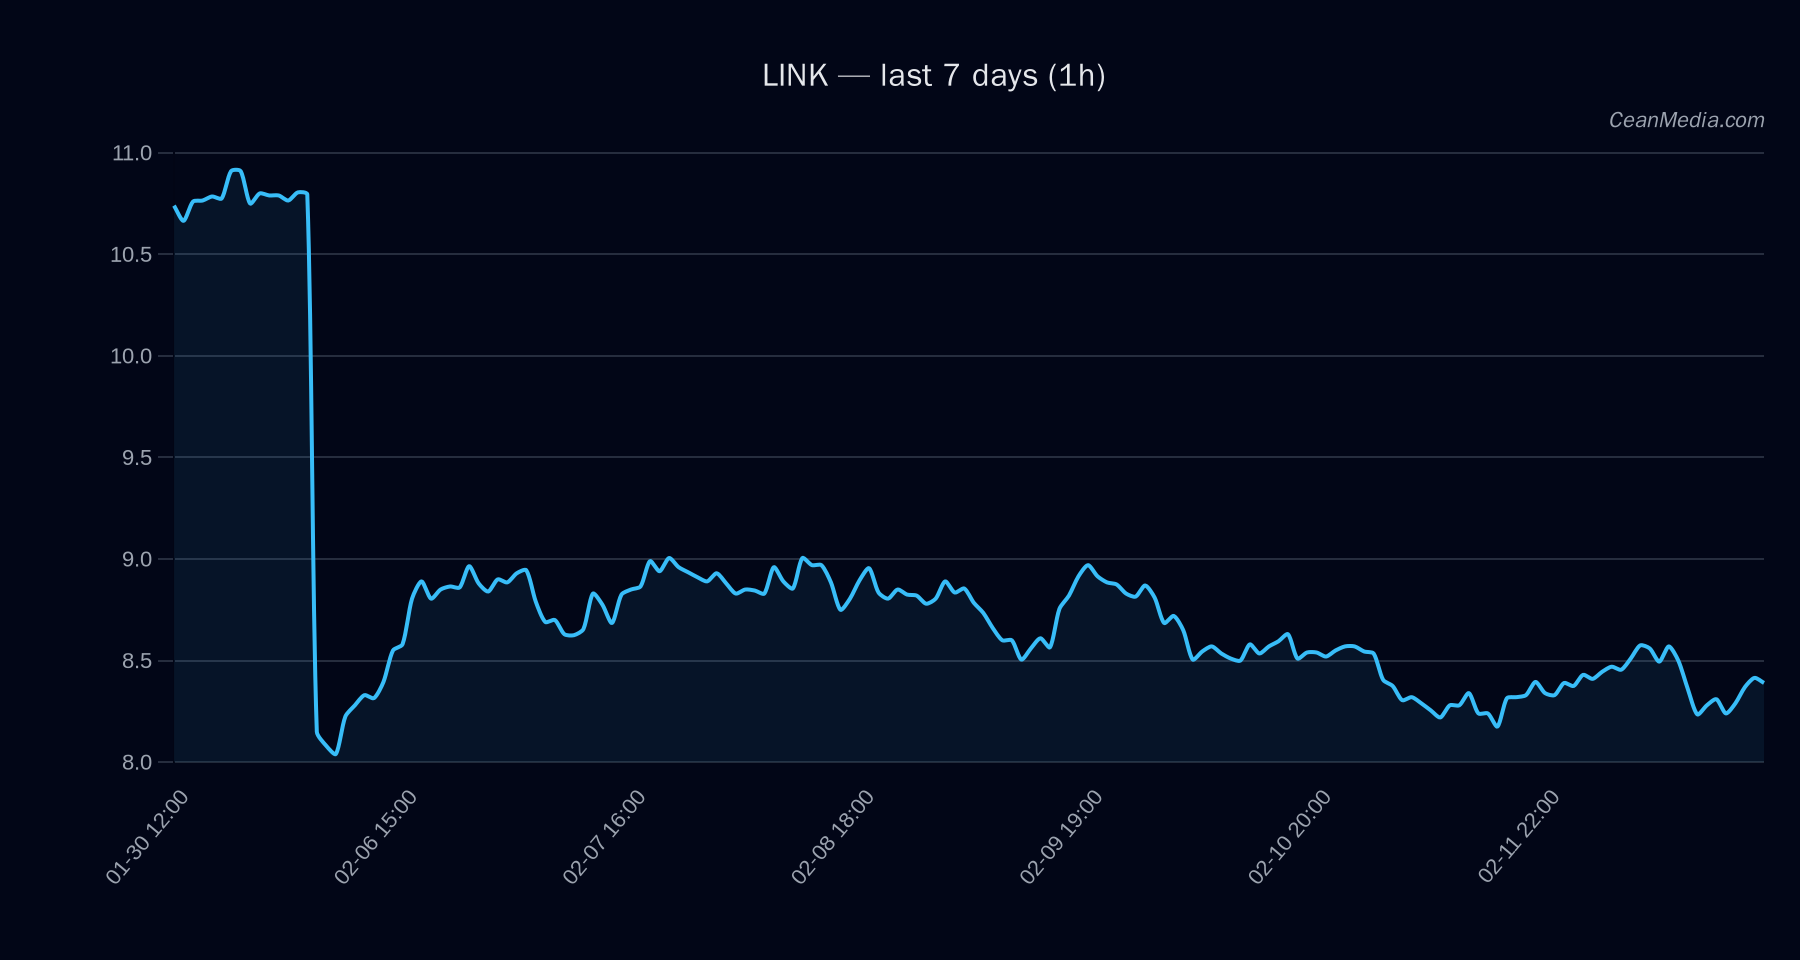
Market Snapshot
Current price: 8.39. The latest short-term forecast for LINK is down with a 55% probability, while the up and sideways probabilities stand at 31% and 14% respectively. The price sits between a near-term support of 8.22 and a near-term resistance of 8.56, with a major resistance at 9.36 and major support at 8.38. The context indicates a bearish tilt in the immediate horizon given the EMA and SMA relationships and a neutral RSI near 50.
Technical Analysis: LINK
- Trend framework: Bearish. EMA12 is below EMA26 and SMA50 is below SMA200.
- Momentum: RSI around 50, indicating neutral strength in the current window.
- Volatility regime: Very low (σ24h ~0.72%), suggesting muted intraday swings.
- Price bands: Target band (P20–P80) at 7.91–8.4452; P50 (mid) at 8.1326.
- Key levels:
- Near-term support: 8.22
- Major support: 8.38
- Near-term resistance: 8.56
- Major resistance: 9.36
- Forecast: Down (55% probability) with a neutral to bearish bias based on the EMA/SMA configuration and RSI reading.
- Breakout/invalidations:
- Upward trigger: 1h close above 8.56 (target 8.729–8.9001).
- Downward trigger: 1h close below 8.22 (target 8.0578–7.8933).
Drivers
- EMA slope: Positive but small (0.0005), indicating a shallow uptick in moving averages while price remains constrained.
- Funding Z-score: 1.21 and Basis Z-score: 0.52, pointing to modest momentum signals with no extreme divergence.
- Order-book imbalance (EMA5): -0.01, suggesting slight selling pressure on short timeframes.
- BTC-related factors: BTC return in the last 24h was negative (-2.29%), BTC volatility regime ranked as 1 (low) and trend strength at ~0.66, indicating muted risk-on sentiment in BTC context.
- Other metrics: Depth Z and Spread Z show mixed readings; breadth signals indicate breadth >50h at 33% context, which is not supportive of a broad bullish breadth for LINK at this time.
ETF Flows (BTC/ETH)
Context: ETF flow data provided pertains to BTC and ETH only and should be treated as contextual market sentiment rather than a primary signal for LINK. The BTC ETF shows a 1D net outflow of -$202.9M, with a 5D inflow of +$39.9M and a 10D large outflow of -$1.05B. The ETH ETF shows a 1D net outflow of -$99.7M, with 5D and 10D inflows/outsized outflows of -$82.0M and -$419.7M respectively. These figures suggest episodic risk-off to risk-on shifts in broader crypto markets but are not definitive drivers for LINK price movements by themselves.
What to Watch Next
- Observe price action around 8.56 for potential breakout toward 8.73–8.90 if break occurs with volume.
- Monitor 8.22 on a close below for potential move toward 8.06–7.89 and consider risk management adjustments.
- Watch BTC market cues and ETF flow shifts in coming sessions as supplementary context for risk sentiment, while keeping LINK analysis independent of BTC/ETH signals.
- Keep an eye on volatility regime changes; a move from very low could precede larger intraday swings affecting short-term targets.
Hashtags: #LINKanalysis #CryptoTechnicals #MarketSnapshot #BTCFlows #ETHFlows #ETFFlows #CryptoMarket #AltcoinAnalysis #TradingStrategy #RiskManagement #PriceAction #Liquidity