Market Snapshot
BTC trades around the 67,650–70,400 range with short-term momentum showing a dip bias. EMA12 remains above EMA26, while SMA50 remains below SMA200, indicating mixed intermediate-term signals. RSI sits at 67, signaling near-overbought conditions on the immediate timeframe, though overall volatility is described as very low. Broad context remains dominated by minimal volume and caution in breadth signals.
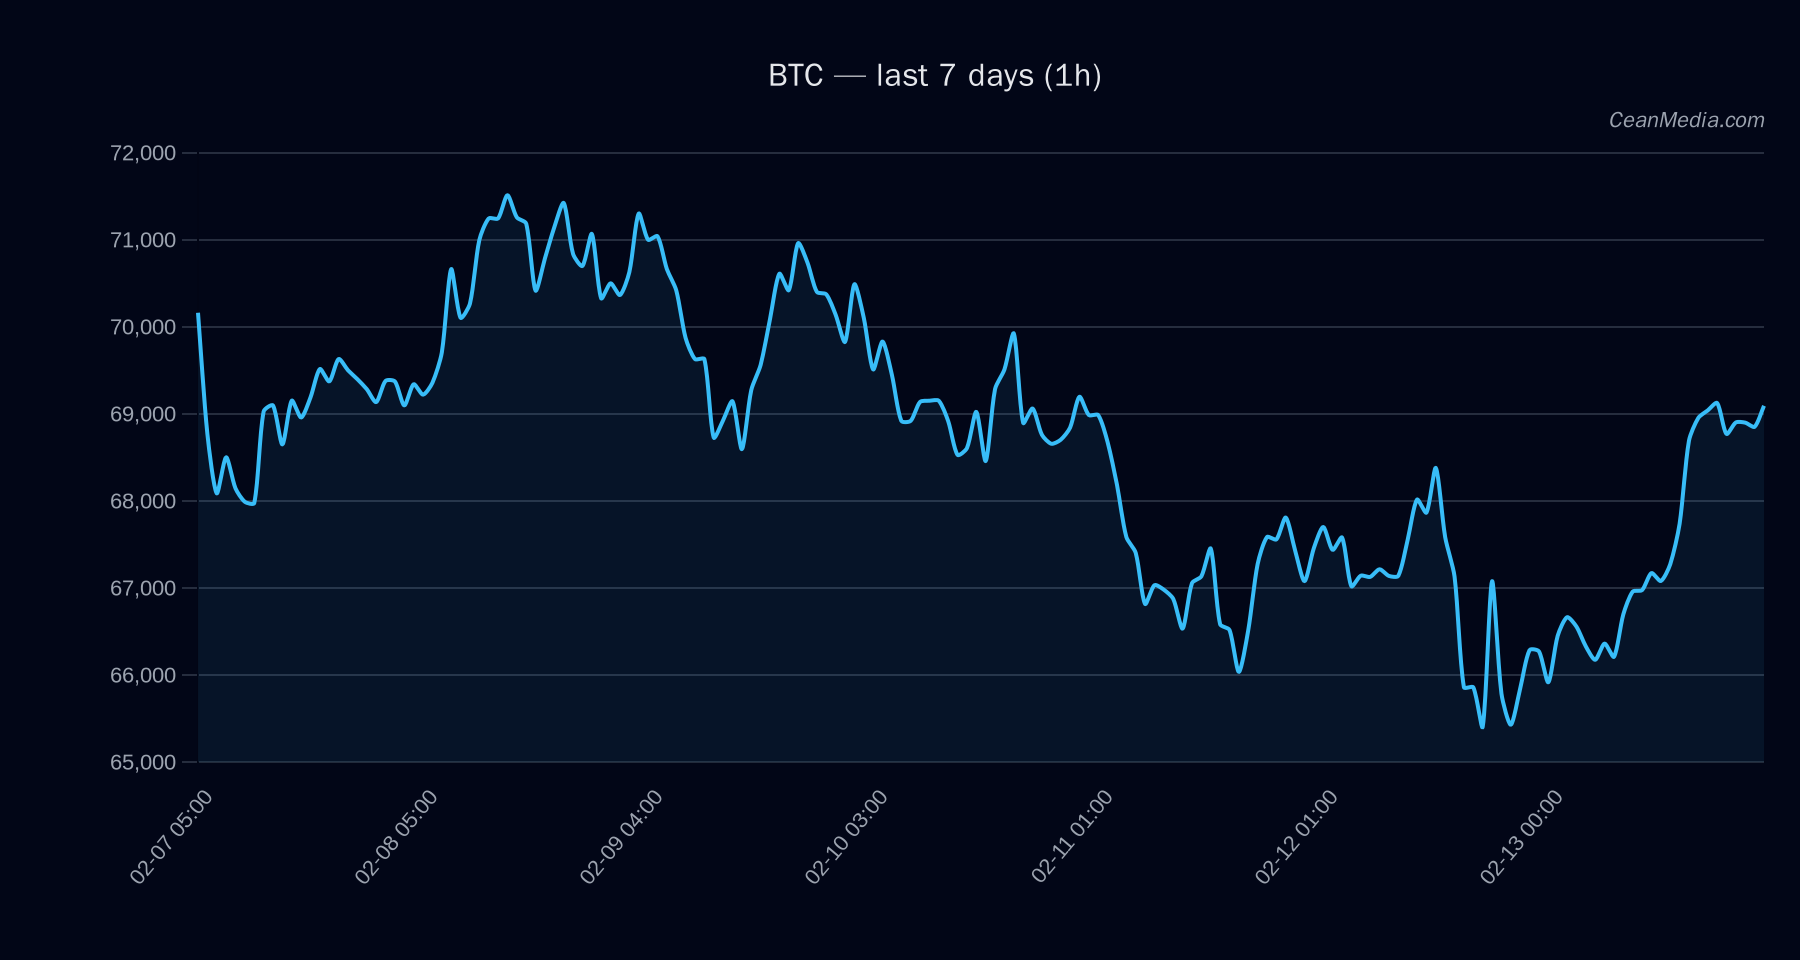
Technical Analysis: BTC
- Current price: 69,025.39
- Bias: Down (48% forecast probability) with sideways tendencies under the current technical setup
- Key indicators: EMA12>EMA26, SMA50
- P50 target (mid-point): 68,950.50
- Band (P20–P80): 67,330.51 – 71,823.30
- Support (Major): 67,125
- Support (Near): 67,650
- Resistance (Major): 72,575
- Resistance (Near): 70,400
- Upside trigger: 1h close > 70,400 → 71,814.02 – 73,222.13
- Downside trigger: 1h close < 67,650 → 66,291.98 – 64,939.09
Forecast interpretation: The market is within a defined range, with a potential downside skew if support at 67,650 gives way. The near-term setup remains cautious with a sideways bias under current momentum and low volatility conditions.
Drivers
- Return over 24h: 0.05%
- EMA slope: 0.0018
- Funding Z-score: -0.05
- Basis Z-score: -0.07
- Order-book imbalance (EMA5): -0.28
- BTC return 24h: 0.05%
- BTC vol regime: 0 (low)
- BTC trend strength: 2.24
Overall, momentum indicators point toward subdued activity with a slight downside tilt if support at 67,650 fails. The trend strength remains moderate, consistent with a cautious trading stance.
ETF Flows (BTC/ETH)
Contextual ETF flow data is provided for BTC and ETH only and is not a primary signal for BTC price action. The latest figures show the following:
- BTC ETF: 1D flow −$276.3M; 5D flow −$33.5M; 10D flow −$1.13B
- ETH ETF: 1D flow −$129.1M; 5D flow −$111.4M; 10D flow −$449.1M
Interpretation: Across both assets, ETF data indicates net outflows over the observed windows, which can reflect broader risk-off sentiment or reallocation tendencies. This is context for macro flows rather than a direct signal for BTC-specific intra-day moves. Traders should weigh ETF dynamics alongside price action, liquidity, and on-chain signals.
What to Watch Next
- Monitor price action around 67,650 for any sustained break; a break below could open 66,291 and 64,939 levels.
- Watch for a breakout above 70,400 to confirm a bullish resumption toward 71,814 and 73,222.
- Observe volume and breadth developments as volatility remains very low, which can precede sharper moves if a volatility regime shifts.
- Keep ETF flow context in mind, especially BTC/ETH outflows, as a risk-off backdrop may persist in the short term.
Hashtags: #btc #bitcoin #marketanalysis #technicalanalysis #etfflows #riskmanagement #tradingideas #cryptomarkets #cryptoNews #volumeanalysis #priceaction #macroflows