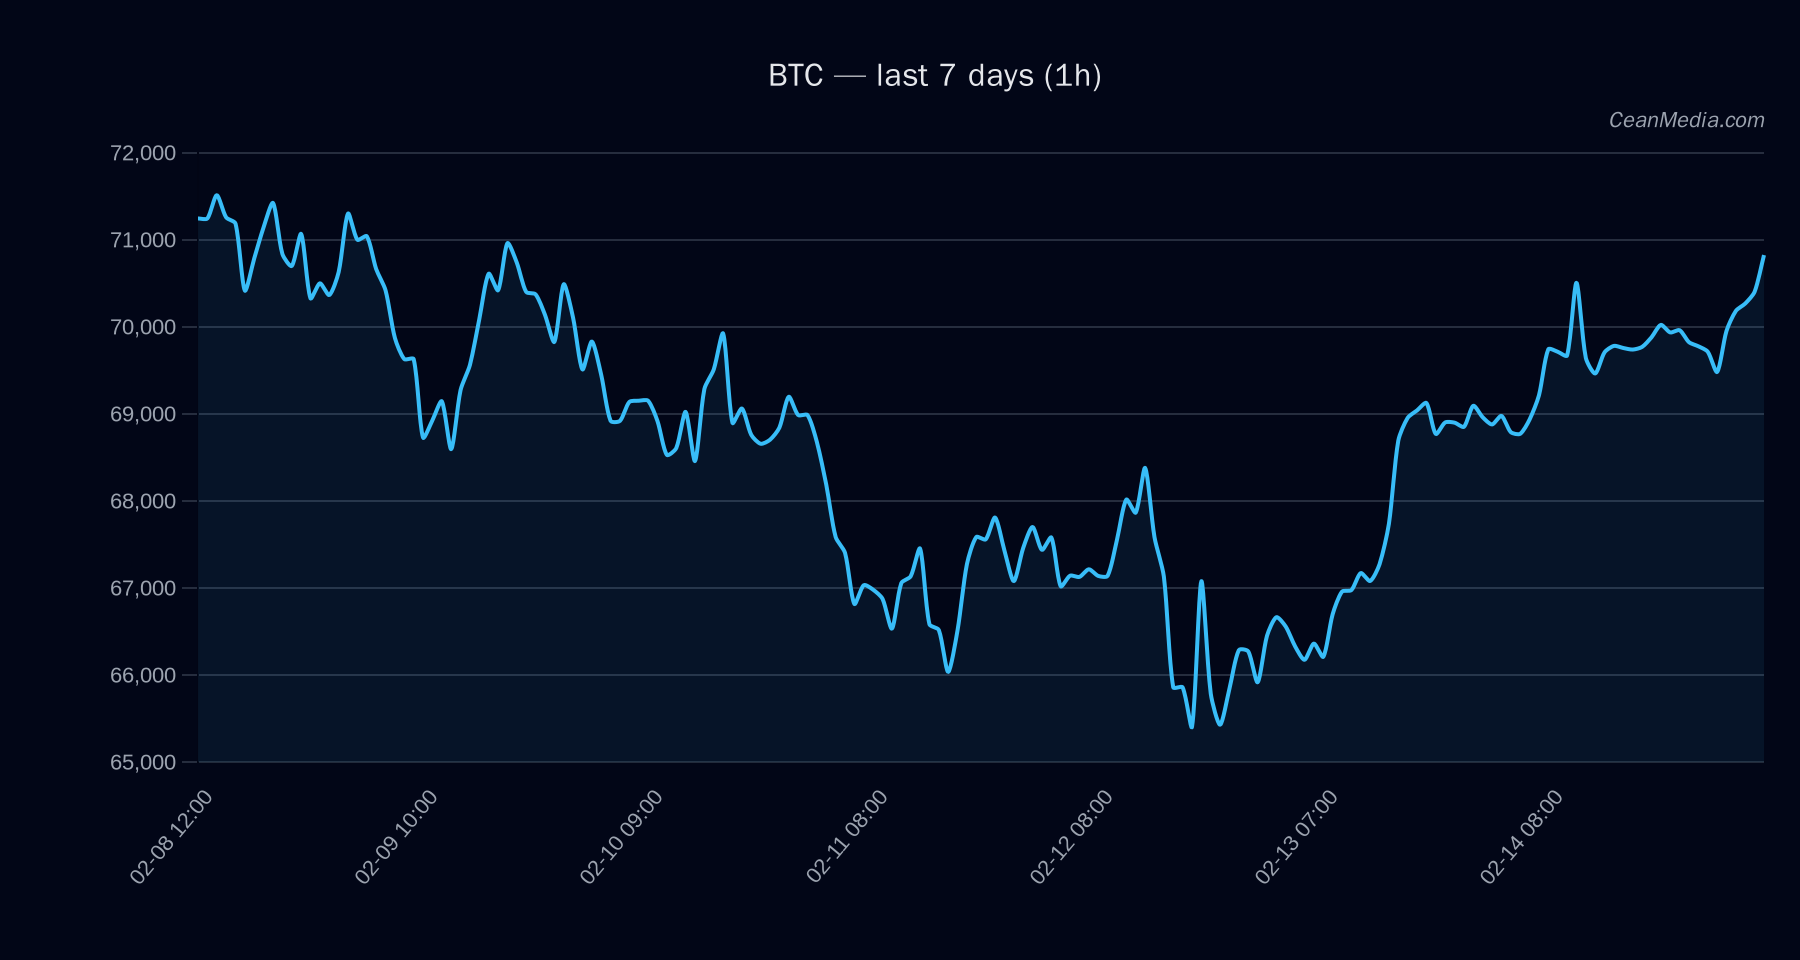
Market Snapshot
Price: 70,825.26 USD. The market is trading within a defined range with near-term downside risk favored if key supports give way and upside limited by current overbought metrics. Overall breadth measures and liquidity signals point to a cautious setup amid very low volatility regime.
Technical Analysis: BTC
- : Down (47% forecast probability). Short-term indicators retain bullish intra-structure signals (EMA12>EMA26, SMA50>SMA200) but RSI at 71 suggests near-term overbought pressure.
- :
- Major Support: 67,425
- Near Support: 69,400
- Major Resistance: 74,225
- Near Resistance: 72,250
- Trade Triggers:
- Upside trigger: 1h close > 72,250 targets 73,686.60 – 75,131.44
- Downside trigger: 1h close < 69,400 targets 68,020.58 – 66,632.40
- Forecast Perspective: The setup is considered bearish in the near term, with a 24h horizon probability of downward movement around 46.5%, while short-term momentum remains positive but with limited upside given volatility is Very Low.
- Momentum/Volatility: BTC trend strength around 1.05; volatility regime: Very low; RSI at 71 indicates potential overbought conditions despite the down bias.
Drivers
- Return 24H: +0.02%
- EMA Slope: +0.0019
- Funding Z-Score: +0.86
- Basis Z-Score: -0.19
- Order-Book Imbalance (EMA5): -0.18
- BTC Return 24H: +0.02%
- BTC Vol Regime: Very low
- BTC Trend Strength: ~1.05
ETF Flows (BTC/ETH)
ETF flow context is provided for BTC and ETH only and should be considered as supplementary context rather than a primary signal for BTC price action. The latest data show BTC ETFs: +$15.1M (1D), +$415.7M (5D), -$611.8M (10D). ETH ETFs: +$11.7M (1D), -$21.8M (5D), -$334.4M (10D).
The flows suggest fresh short-term demand for BTC exposure but the longer-dated trend is mixed, aligning with a cautious market tone rather than a decisive directional cue for BTC itself.
What to Watch Next
- Watch for a close above 72,250 to validate the upside trigger toward 73,686.60 – 75,131.44.
- Monitor a break below 69,400 for potential acceleration toward 68,020.58 – 66,632.40.
- Keep an eye on RSI evolution around 70–75 region to assess potential cooling or continuation of momentum.
- Assess ETF flow developments as supplementary risk-on/off context, not as primary BTC signal.
Hashtags: #Bitcoin #BTCAnalysis #CryptoMarkets #ETFFlows #TechnicalAnalysis #MarketOutlook #PriceAction #EMA #RSI