Market Snapshot
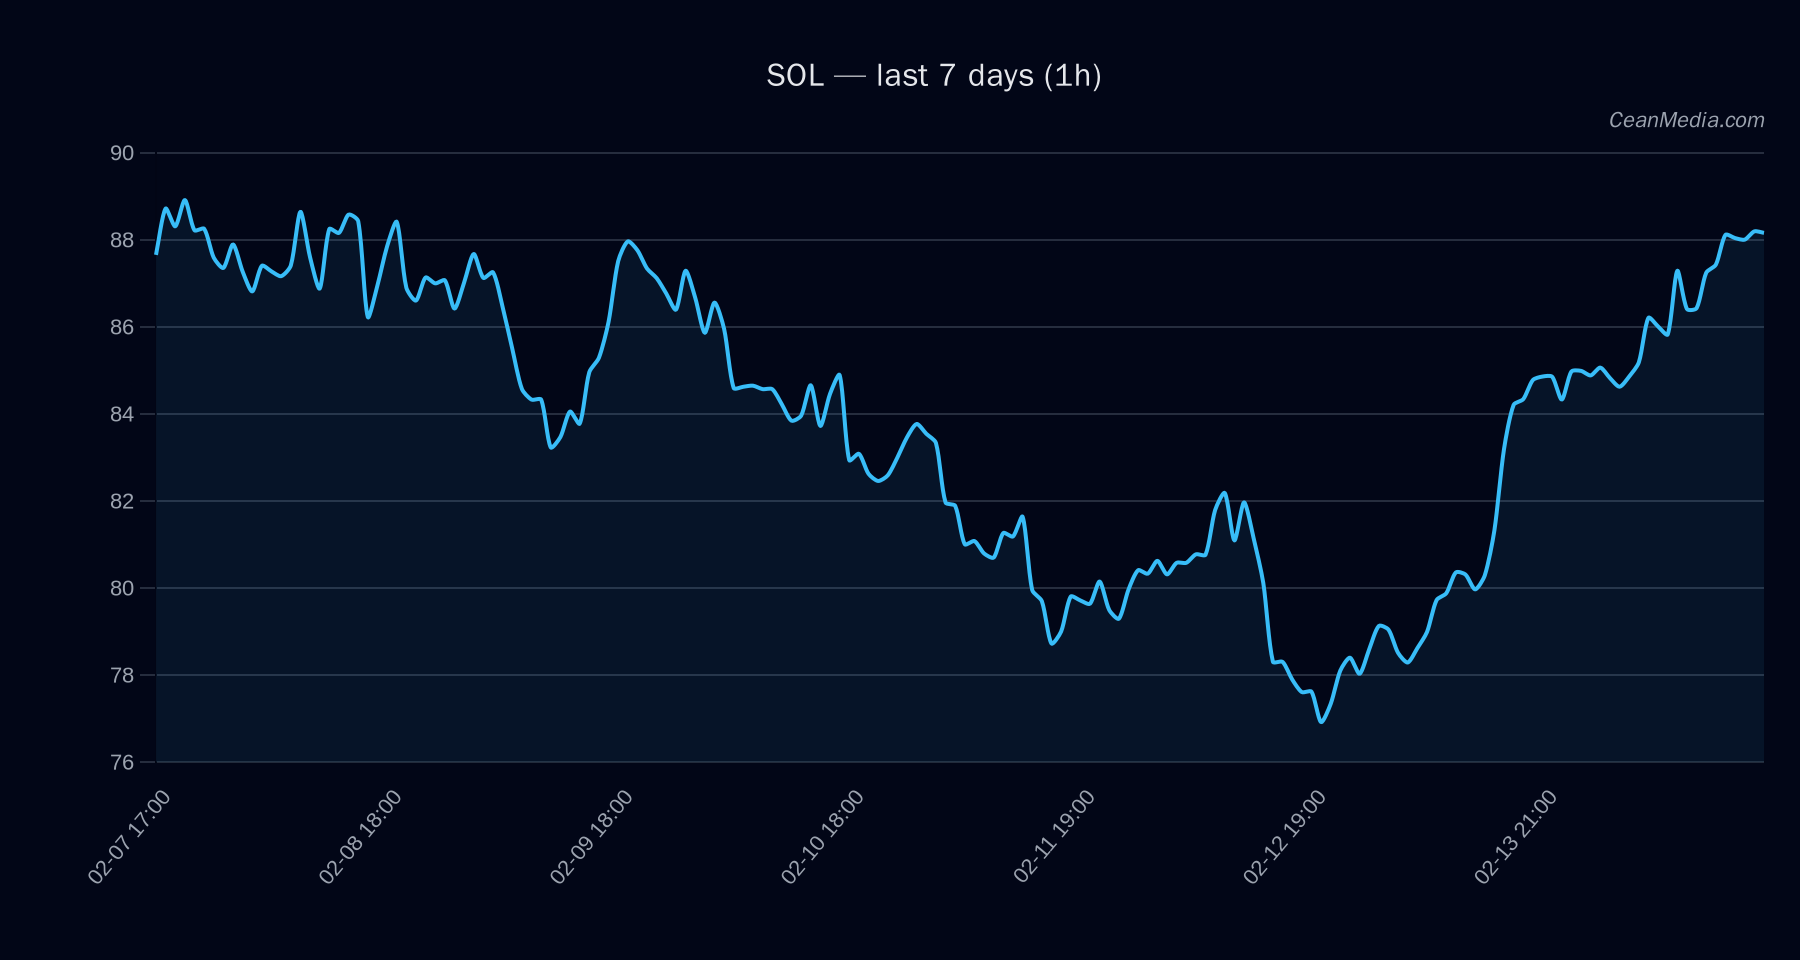
On 2026-02-14, SOL traded around the mid-80s to high-80s range with a short-term bias toward downside. The price action sits between a near-term support at 85.7 and resistance at 89.2, with a potential breakout to the upside above 89.2 and a downside tilt below 85.7. Overall sentiment shows very low volatility regime and a sideways to down-leaning trajectory according to the latest TA read.
Technical Analysis: SOL
- Current Price (approx): 87.49
- Bias / Forecast: Down (48%) with sideways signal in the near term
- Key Levels:
- Near-term Support: 85.7
- Major Support: 80.2
- Near-term Resistance: 89.2
- Major Resistance: 94.8
- Indicators:
- EMA12 > EMA26
- SMA50 < SMA200
- RSI: 66
- Volatility (σ24h): 0.61%
- Vol Regime: Very low
- Projected paths:
- Upside scenario: If 1h close > 89.2, target range ~91.02 – 92.81
- Downside scenario: If 1h close < 85.7, target range ~84.03 – 82.31
- Invalidation: Break below major support (80.2) or above major resistance (94.8) would warrant re-evaluation of the current bias.
Top Drivers
- Return 24H: 0.04
- EMA Slope: 0.0019
- Funding Z-Score: 0.08
- Basis Z-Score: -1.32
- Order-Book Imbalance (EMA5): 0.02
- BTC Return 24H: 0.02
- BTC Vol Regime: 0
- BTC Trend Strength: 0.84
ETF Flows (BTC/ETH)
The ETF flow data provided covers BTC and ETH only and should be interpreted as context rather than a primary signal for SOL. In this reporting period, BTC ETFs show positive inflows in the 1D and strongly positive flows over 5D, while 10D shows a decline. ETH ETFs show positive 1D flows but negative 5D and 10D flows. This suggests a short-term risk-on tilt in BTC/ETH sentiment, but does not directly imply SOL directional bias. Market participants should weigh ETF flows as macro liquidity cues rather than asset-specific signals.
- BTC ETF: 1D +$24.5M, 5D +$425.1M, 10D -$602.4M
- ETH ETF: 1D +$21.0M, 5D -$12.5M, 10D -$325.1M
What to Watch Next
- Watch for a close above 89.2 to validate upside bias toward 91.0–92.8.
- Monitor if price holds above 85.7; a break below could extend downside toward 84.0–82.3.
- Observe evolving BTC/ETH ETF flows for liquidity signals, recognizing they are context rather than SOL signals.
- Keep an eye on volatility regime shifts as a potential precursor to larger moves.
Hashtags: #Solana #SOL #CryptoAnalysis #MarketSnapshot #TechnicalAnalysis #ETFFlows #BTC #ETH #CryptoMarkets #PriceAction #Volatility #Liquidity