Market Snapshot
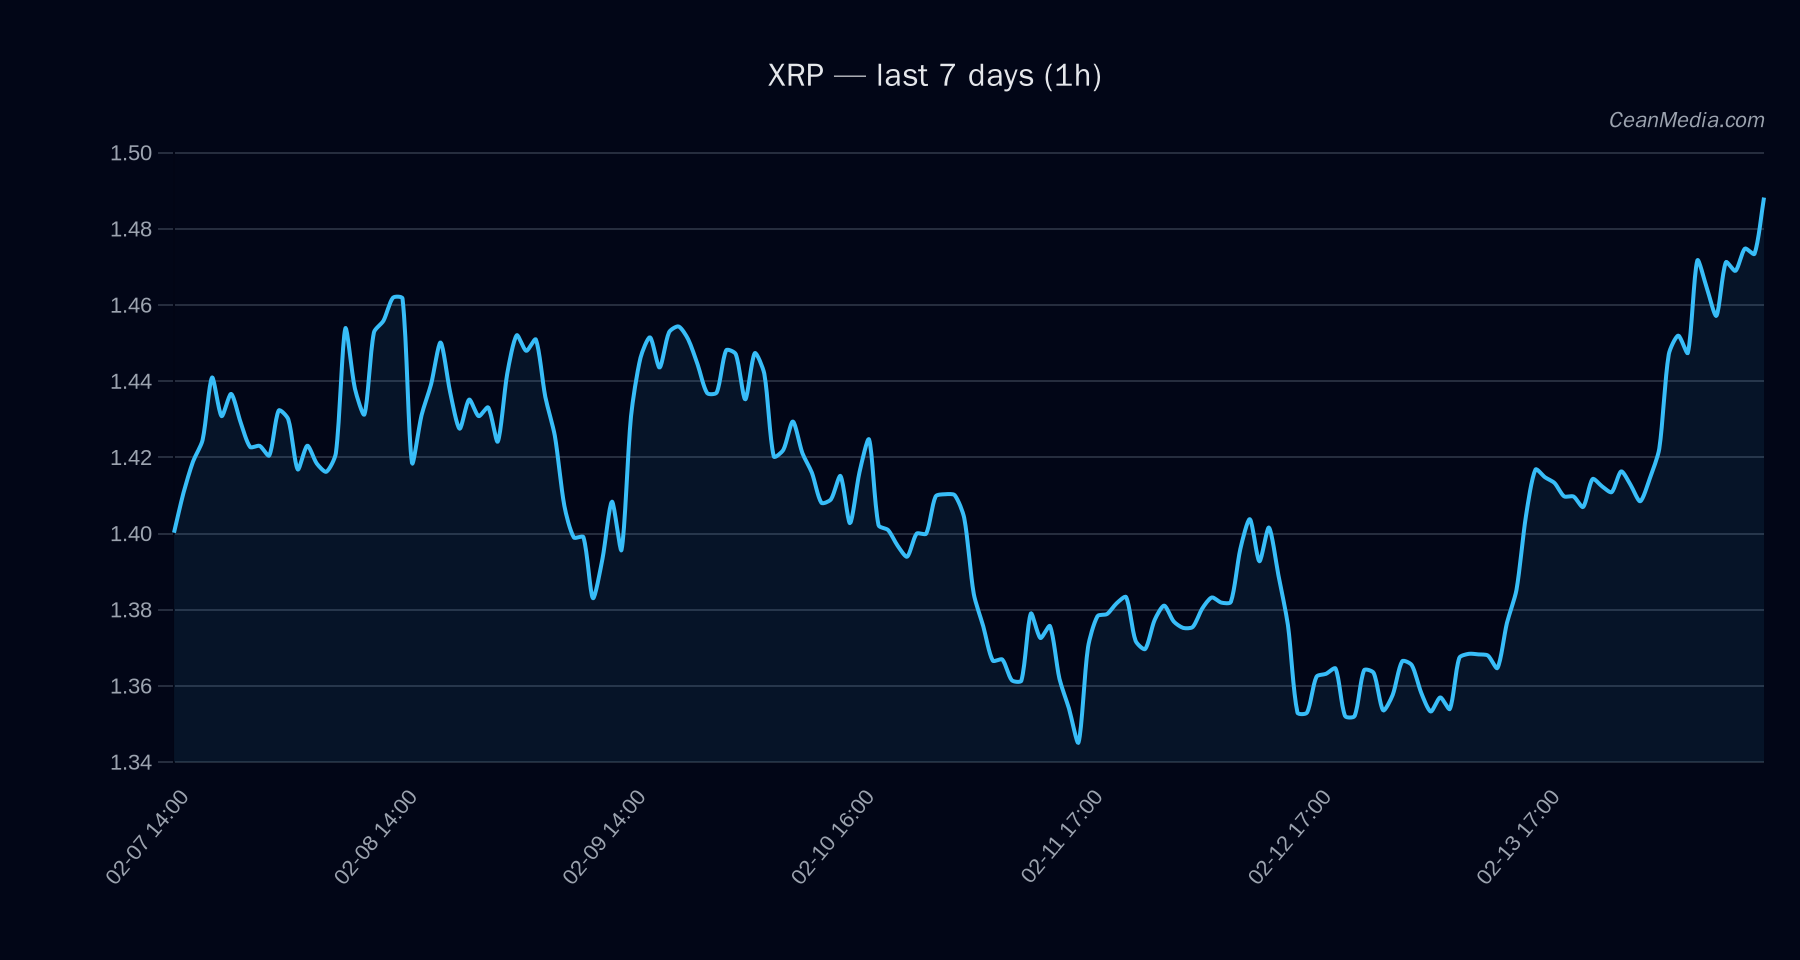
Trading view for XRP on 2026-02-14 shows price around 1.49, with a short-term bias to the downside (probability 52% for down). Key metrics indicate an overbought RSI near 77, subdued volatility regime (Very low), and mixed momentum signals across moving averages ( EMA12 > EMA26; SMA50 < SMA200). The broader context includes extreme fear signals in market sentiment and a breadth-reading of strong participation, with BTC and alt breadth showing mixed signals.
Technical Analysis: XRP
- Current range: 1.38 (major support) to 1.64 (major resistance). Near-term bands 1.46–1.52.
- Key levels: Support near 1.46; resistance near 1.52. Break above 1.52 targets 1.5545–1.5849. Break below 1.46 targets 1.4349–1.4056.
- Bias and indicators: Forecasted as DOWN with a 52% probability; RSI at 77 indicates overbought conditions. EMA/MA configuration shows mixed trend (EMA12 > EMA26; SMA50 < SMA200) with very low volatility (σ24h ≈ 0.65%).
- Momentum triggers: Upside trigger if 1h close > 1.52; downside trigger if 1h close < 1.46. Band width (P20–P80) is 1.3924–1.5034, supporting a narrow range bias in the immediate term.
- Forecast takeaway: The forecast points to a downside tilt within the current range, with sideways contextual movement given the mixed MA signals and high RSI.
Drivers
- Return over the last 24 hours: +0.05
- EMA slope: +0.0034
- Funding Z-score: -0.94
- Basis Z-score: -0.99
- Order-book imbalance (EMA5): +0.07
- BTC 24h return: +0.0093
- BTC volatility regime: 0 (neutral)
- BTC trend strength: 0.43
- Volume and volatility context (volatility of volatility, etc.): very low to low emphasize a calm near-term environment
ETF Flows (BTC/ETH)
Contextual note: ETF flow data shown below pertains exclusively to Bitcoin and Ethereum and should be treated as contextual risk sentiment rather than a direct signal for XRP. The BTC/ETH flows can influence risk appetite and correlations across markets, but XRP-specific moves are driven by idiosyncratic and XRP-internal factors.
- BTC ETF: +$24.5M today; +$425.1M over 5 days; -$602.4M over 10 days
- ETH ETF: +$21.0M today; -$12.5M over 5 days; -$325.1M over 10 days
What to Watch Next
- Watch for a close above 1.52 to confirm potential upside continuation toward 1.5545–1.5849.
- Monitor if XRP breaks below 1.46 to validate the downside target range of 1.4349–1.4056.
- Observe RSI behavior for any further overbought/oversold signals that could precede a shift in momentum.
- Keep an eye on BTC/ETH ETF flow momentum as a contextual indicator of overall risk sentiment, not a direct XRP signal.
Hashtags: #XRP #CryptoAnalysis #TechnicalAnalysis #MarketSnapshot #ETFFlows #BTC #ETH #AltMarkets #Liquidity #Volatility #RSI #MA