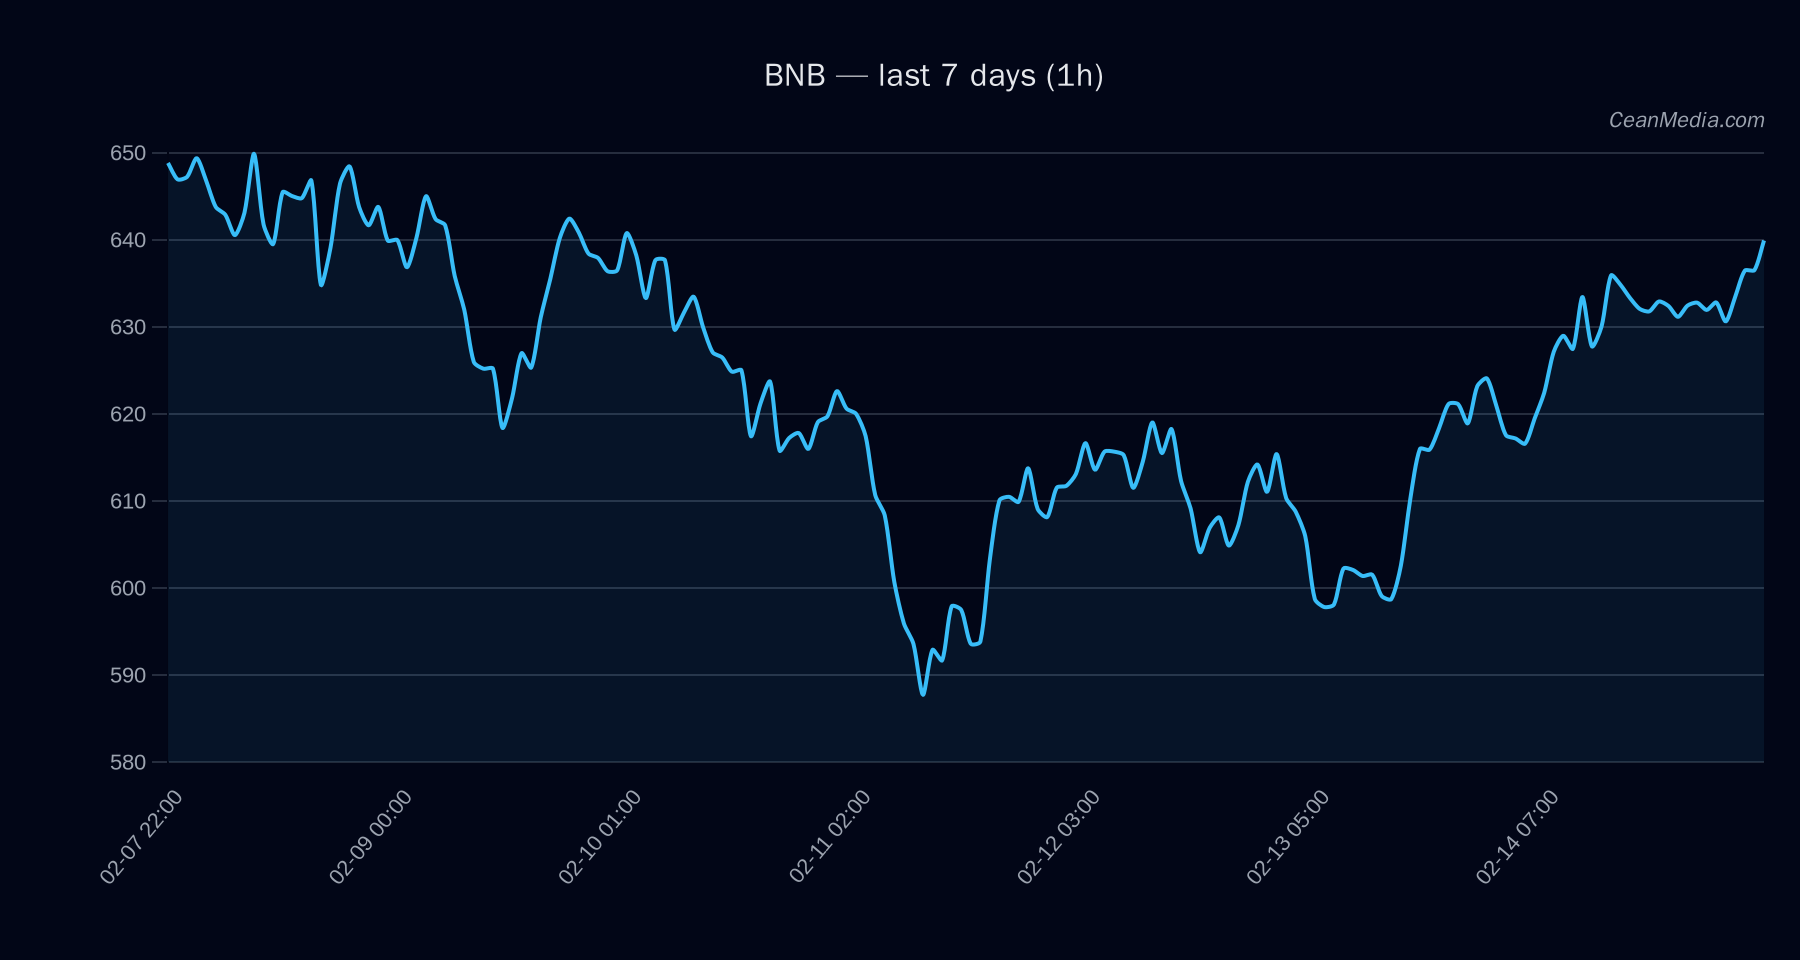
Market Snapshot
BNB trades around the mid-600s with near-term resistance at 653 and support near 627. The price sits between a defined support and resistance band, with a short-term bias leaning toward an upside break above 653 to target the 665.78–678.84 zone, while a break below 627 opens downside toward 614.59–602.05. Market breadth remains strong on a 50-hour horizon, and overall volatility is described as very low.
Technical Analysis: BNB
- Price (spot): 639.93
- Short-Term Forecast: Up (50%), with Up 50%, Side 9%, Down 41% as per model signals
- Key Indicators: EMA12 > EMA26; SMA50 < SMA200; RSI 69; 24h vol sigma 0.42%
- Band (P20–P80): 613.47 – 653.99
- Major/Near-Term Levels: Support 612 (major), Near 627; Resistance 671 (major), Near 653
- Upside/Downside Triggers: Upside: 1h close > 653 targets 665.78–678.84; Downside: 1h close < 627 targets 614.59–602.05
- Volatility Regime: Very low
- Notable Context: RSI neutral around 69; trend indicators show mixed but leaning supportive of a near-term up move if 653 is breached
Drivers
- Return 24h: 0.03
- EMA slope: 0.001
- Funding Z-Score: 0.67
- Basis Z-Score: 0.16
- Order-book Imbalance (EMA5): -0.15
- BTC Return 24h: 0.02
- BTC Vol Regime: 0
- BTC Trend Strength: 0.97
ETF Flows (BTC/ETH)
The ETF flow context provided focuses on BTC and ETH. BTC ETF shows +$15.1M on 1D, +$415.7M on 5D, and -$611.8M on 10D. ETH ETF shows +$11.7M on 1D, -$21.8M on 5D, and -$334.4M on 10D. These data points reflect risk-on/risk-off dynamics in broader markets but are not primary signals for BNB. They should be considered as contextual pressure on macro sentiment that may influence crypto correlations and liquidity indirectly.
What to Watch Next
- Watch for a close above 653 to validate the upside continuation toward 665.78–678.84.
- Monitor price action near 627 for potential pullback targets around 614.59–602.05.
- Keep an eye on broader market liquidity and Bitcoin trend signals as they can affect BNB correlations in a low-volatility regime.
- Assess any shifts in EMA relationships (EMA12 vs EMA26) and RSI momentum that could alter the bias.
Hashtags: #BNB #BTC #ETH #CryptoAnalysis #MarketSnapshot #TechnicalAnalysis #ETFFlows #CryptoTrading #PriceAction #Liquidity #Altcoin