Market Snapshot
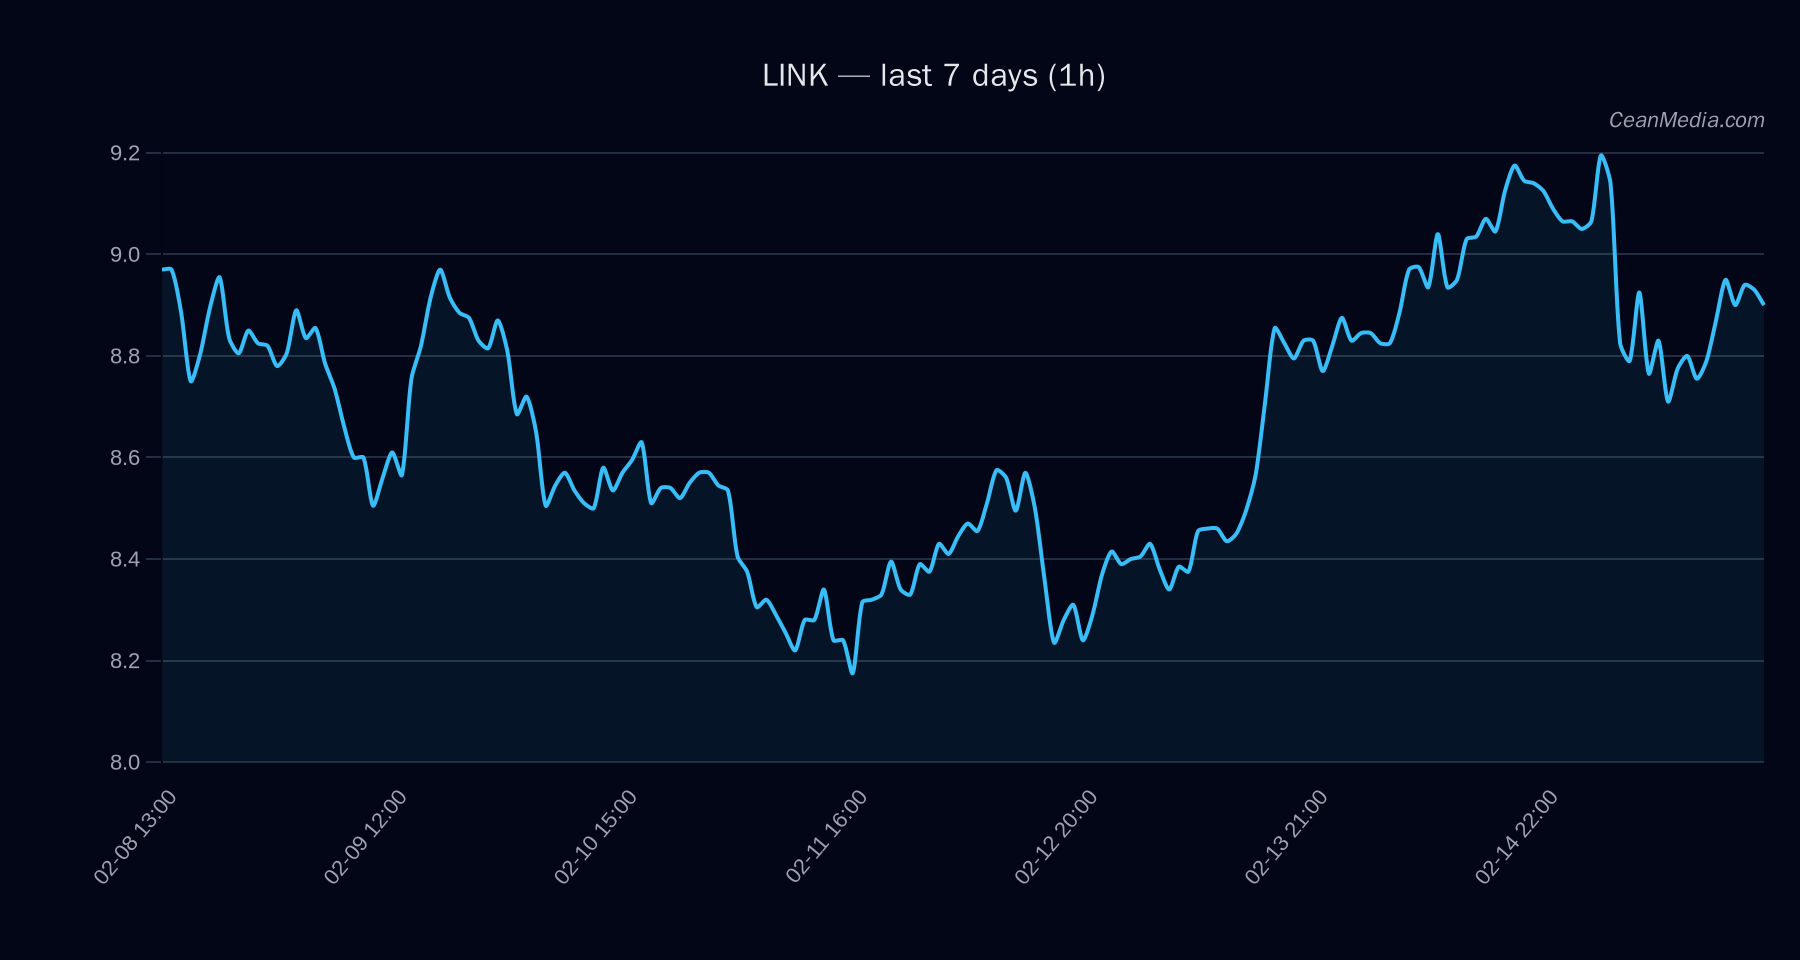
On 2026-02-17, LINK trades near key support and resistance with a mixed short-term bias. Price sits around 8.9, within a narrow range defined by major support at 8.4 and near-term resistance at 9.16. The broader context shows low volatility and a mixed momentum backdrop, with the EMA relationship indicating a potential sideways bias.
Technical Analysis: LINK
- Current price: 8.98
- Short-Term Forecast: down (50%)
- Probability mix: Up 48%, Side 2%, Down 50%
- Key indicators: RSI 55; EMA12
- P50: 9.1719
- Band (P20–P80): 9.1693 – 9.41
- Support: Major 8.4 | Near 8.8
- Resistance: Major 10 | Near 9.16
- Upside trigger: 1h close > 9.16 → 9.3428 … 9.526
- Downside trigger: 1h close < 8.8 → 8.6244 … 8.4484
- Bias: Sideways with mild downside risk under current conditions
- Invalidation: Break above 9.16 with sustained 9.34–9.53 targets; break below 8.8 undermines the current range and opens 8.62–8.45
Drivers
- Top factors: EMA slope 0.0002, Basis Z-score 1.97, Funding Z-score 0.64
- Order-book balance (EMA5): 0.05
- Volatility regime: Low; vol-of-vol 0.00418
- Market breadth: Breadth > 50h at 67%
- BTC context: BTC volatility regime 1; BTC.D around 56.5% with slight declines over 7 days
- Macro/market sentiment: F&G (Fear & Greed) 10 (Extreme Fear) indicating risk-off backdrop, though LINK-specific setup remains range-bound
ETF Flows (BTC/ETH)
The ETF flow data presented is limited to BTC and ETH ETFs and should be interpreted as context rather than a primary signal for LINK. Recent figures show persistent net inflows for BTC ETFs (+$15.1M today; +$415.7M over 5 days; -$611.8M over 10 days) and inflows for ETH ETFs (+$11.7M today; -$21.8M over 5 days; -$334.4M over 10 days). These flows can reflect broader risk sentiment and capital allocation shifts within crypto markets, which may indirectly influence LINK through correlations and overall market liquidity. However, ETF activity for BTC/ETH is not a direct signal for LINK price movements.
What to Watch Next
- Monitor for a clear break above 9.16 to validate a move toward 9.34–9.53 in the near term.
- Watch for a break below 8.8 to signal potential downside toward 8.62–8.45.
- Observe RSI behavior around 55 and the EMA cross dynamics (EMA12 vs EMA26) for any shift toward a directional regime.
- Keep an eye on BTC/ETH ETF flows as contextual indicators of risk appetite, not primary drivers for LINK.
Hashtags: #LinkAnalysis #CryptoMarkets #TechnicalAnalysis #ETFFlows #BTC #ETH #MarketSnapshot #Altcoins