Market Snapshot
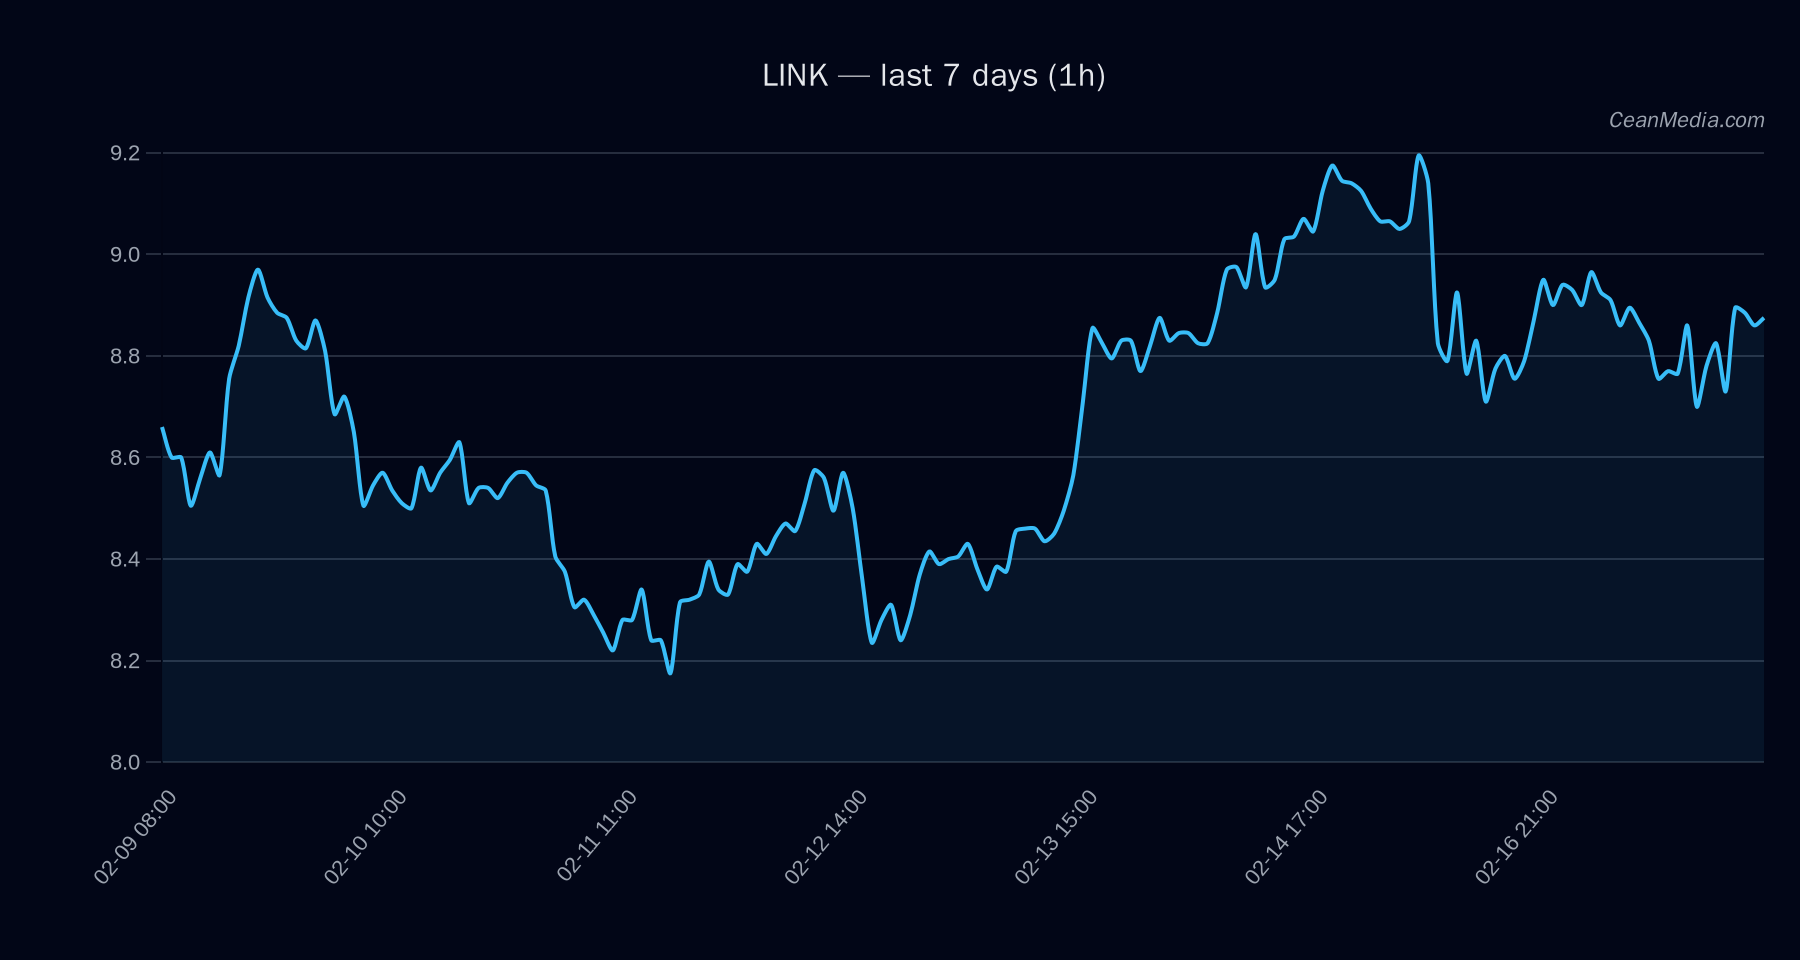
LINK is trading around the 8.86 level, positioned between near-term support at 8.68 and resistance at 9.04. The price action is characterized by a sideways bias in the short term, with the broader context showing a very low volatility regime and a negative 24-hour return backdrop across BTC markets that shades market sentiment.
Key levels to monitor: major support at 8.4, near-term support at 8.68; major resistance at 9.76, near-term resistance at 9.04. An upside breach above 9.04 would target the 9.2179–9.3987 area on the immediate horizon, while a break below 8.68 could extend down to 8.5091–8.3355.
Technical Analysis: LINK
- Current Price: 8.86
- Forecast Bias: Up (49% probability), but overall TA shows sideways movement
- Support / Resistance: Major S 8.4; Near S 8.68; Near R 9.04; Major R 9.76
- Momentum Indicators: EMA12 < EMA26; SMA50 > SMA200; RSI 51 (neutral); Volatility (24h) 0.77% (very low)
- Band / Range: P20–P80: 8.5058 – 9.283; P50 (median) 8.7804
- Upside/Downside Triggers: Upside trigger: 1h close > 9.04 → 9.2179–9.3987; Downside trigger: 1h close < 8.68 → 8.5091–8.3355
Drivers
24h return (-0.0011), EMA slope (0.0006), funding z-score (0.27), basis z-score (0.41), order-book imbalance (EMA5) (0.07) - Market context: BTC 24h return (-0.0113), BTC vol regime (0), BTC trend strength (0.401). Overall breadth metrics indicate limited upside breadth in the near term.
- Volatility regime: Very low; volatility of price movement remains subdued.
ETF Flows (BTC/ETH)
The ETF flow snapshot shows:
- BTC ETF: 1D +$15.1M, 5D +$415.7M, 10D -$611.8M
- ETH ETF: 1D +$11.7M, 5D -$21.8M, 10D -$334.4M
Interpretation: ETF flow data here is limited to BTC and ETH as a context for risk sentiment and liquidity conditions. These flows should be viewed as contextual signals rather than primary drivers for LINK, which is the asset of focus. A risk-on impulse reflected by positive BTC/ETH ETF flows might support broader market participation and risk assets, but is not a direct signal for LINK’s price trajectory.
What to Watch Next
- Watch for a close above 9.04 to validate upside targeting 9.2179–9.3987.
- Monitor a break below 8.68 for potential move toward 8.5091–8.3355.
- Respect the very low volatility regime; confirm any breakout with sustained momentum rather than single-interval moves.
- Keep an eye on BTC/ETH ETF flow shifts as a secondary risk-on/off context, not a primary LINK signal.
Hashtags: #LinkAnalysis #CryptoMarkets #TechnicalAnalysis #ETFFlows #BTC #ETH #MarketSnapshot #Altcoins #PriceLevels #RiskManagement #TradingStrategy