Market Snapshot
Ethereum (ETH) is trading around the mid-to-upper 1,900s with a near-term bias tilted to the downside. The 24-hour price movement shows a marginal gain of 0.05% while intraday volatility remains very low. Market breadth remains subdued, and broad crypto risk appetite is modest at current levels.
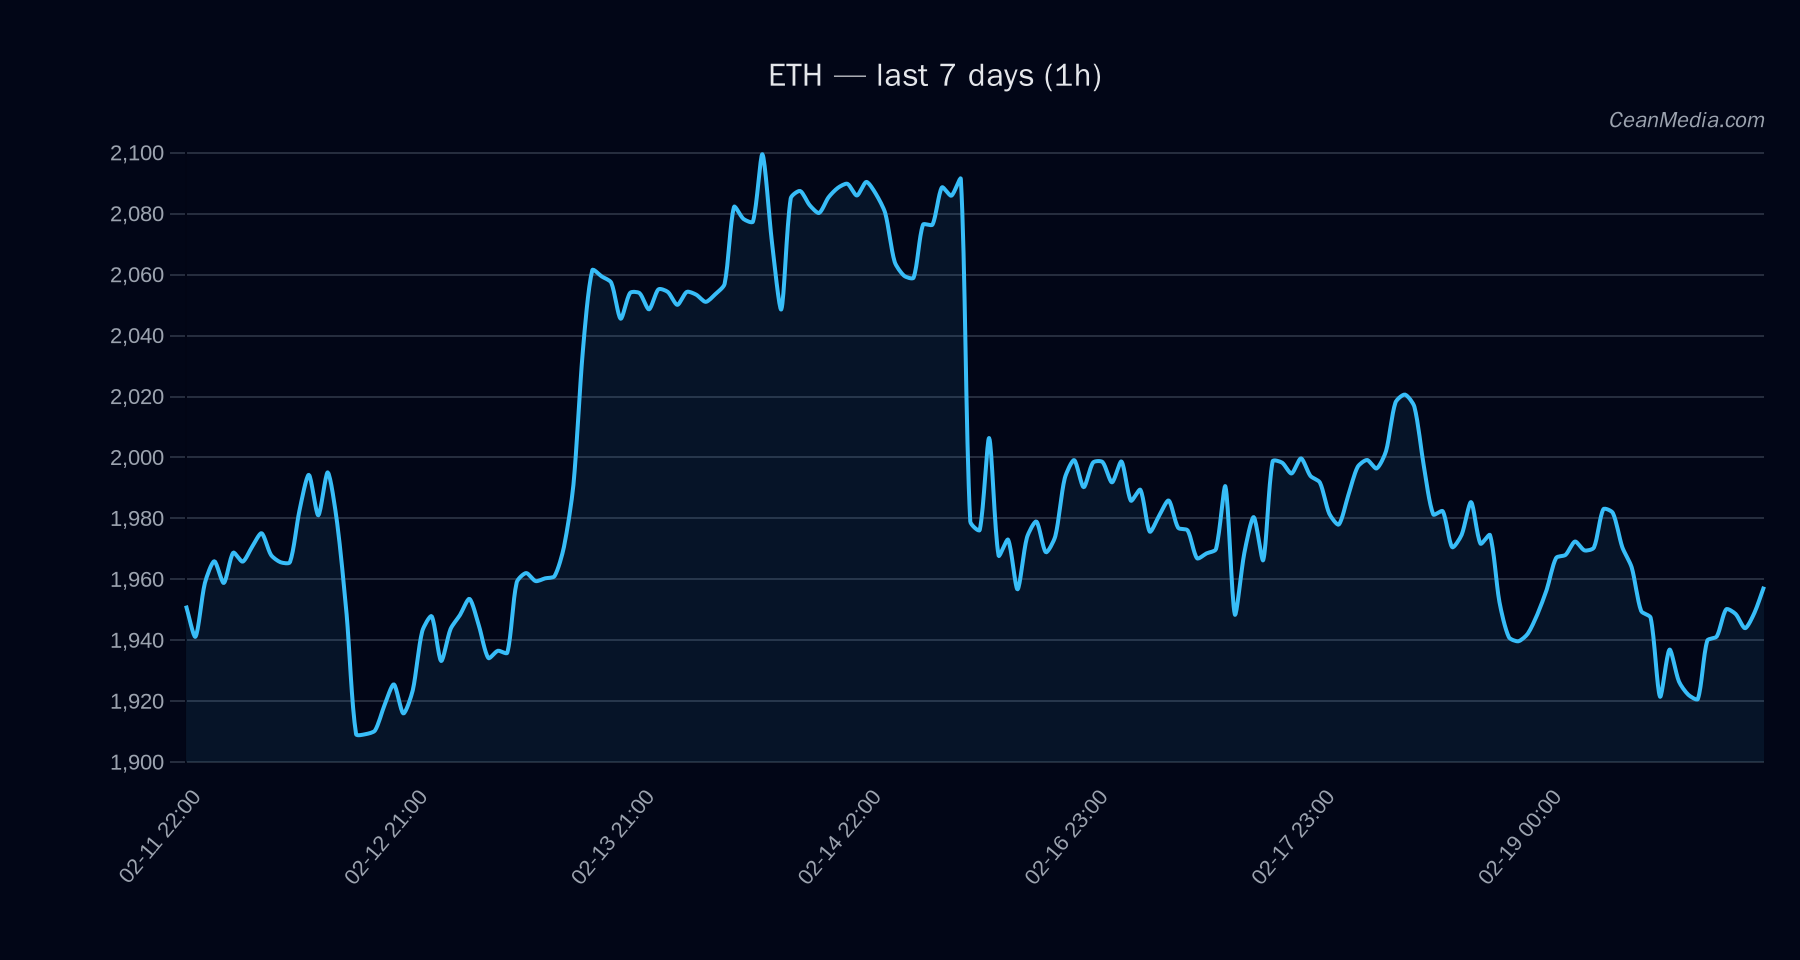
Technical Analysis: ETH
Current Price: 1,957.91
- Short-Term Forecast: Down (48%)
- Probabilities: Up 42%, Side 10%, Down 48%
- Key Indicators: EMA12 < EMA26, SMA50 < SMA200 (bearish cross context), RSI 53
- Volatility: σ24h 0.51%, Vol regime: Very low
Band and Levels
- P50: 1,966.53
- Band (P20–P80): 1,915.91 – 2,056.20
- Major Support: 1,944
- Near Support: 1,918
- Major Resistance: 2,090
- Near Resistance: 1,998
Traders’ Triggers
- Upside Trigger: 1h close > 1,998 → potential range 2,037.01 to 2,076.95
- Downside Trigger: 1h close < 1,918 → potential range 1,880.38 to 1,842.00
Bias & Invalidation: Bearish bias remains with a primary view that breaks above 1,998 would shift toward near-term resistance targets, while a breach below 1,918 would open the lower support pocket.
Contextual Notes: Breadth is modest (54–60% weaker depending on window), BTC correlation remains high (ρ(BTC,72h) ≈ 0.93), and ETF flows for both BTC and ETH are negative in the short term. ETF and broader sentiment should be considered as context rather than primary drivers for ETH price action in this window.
Drivers
- Return 24H: 0.0005
- EMA Slope: Slight positive tilt (0.001)
- Funding Z-Score: -0.06
- Basis Z-Score: 1.37
- Order-Book Imbalance (EMA5): 0.12
- BTC Return 24H: 0.01
- BTC Vol Regime: -1 (low volatility)
- BTC Trend Strength: 0.59
Other quantitative factors such as volatility-of-volatility, distance from moving averages, and recent drawdown contribute to a cautious stance. Overall momentum indicators do not signal a strong immediate reversal, reinforcing the current caution around a sustained breakout.
ETF Flows (BTC/ETH)
Note: ETF flow data presented here is limited to BTC and ETH and serves as contextual market sentiment rather than a primary signal for ETH pricing.
- BTC ETF: 1D -$49.1M; 5D -$155.5M; 10D -$556.2M
- ETH ETF: 1D -$9.9M; 5D -$77.2M; 10D -$136.9M
The latest ETF flow data indicates modest net outflows across both BTC and ETH over the short to medium term. While negative ETF flows can reflect broader risk-off tendencies, they should be interpreted as contextual for ETH rather than a standalone signal. The presence of persistent outflows could contribute to headwinds in the absence of other positive catalysts.
What to Watch Next
- Watch for a close above 1,998 to validate a near-term bullish impulse toward 2,037–2,077.
- Monitor a break below 1,918 to confirm downside extension toward 1,880–1,842.
- Keep an eye on BTC price action and volatility regime, as high correlation could amplify ETH moves in the short run.
- ETF flow updates for BTC/ETH in the coming days, noting that current data is contextual rather than a primary strategy signal.
Hashtags: #ETH #Ethereum #CryptoAnalysis #TechnicalAnalysis #MarketSnapshot #ETFFlows #BTC #RiskOn #PriceAction #Liquidity #TradingSignals #CryptoNews