Market Snapshot
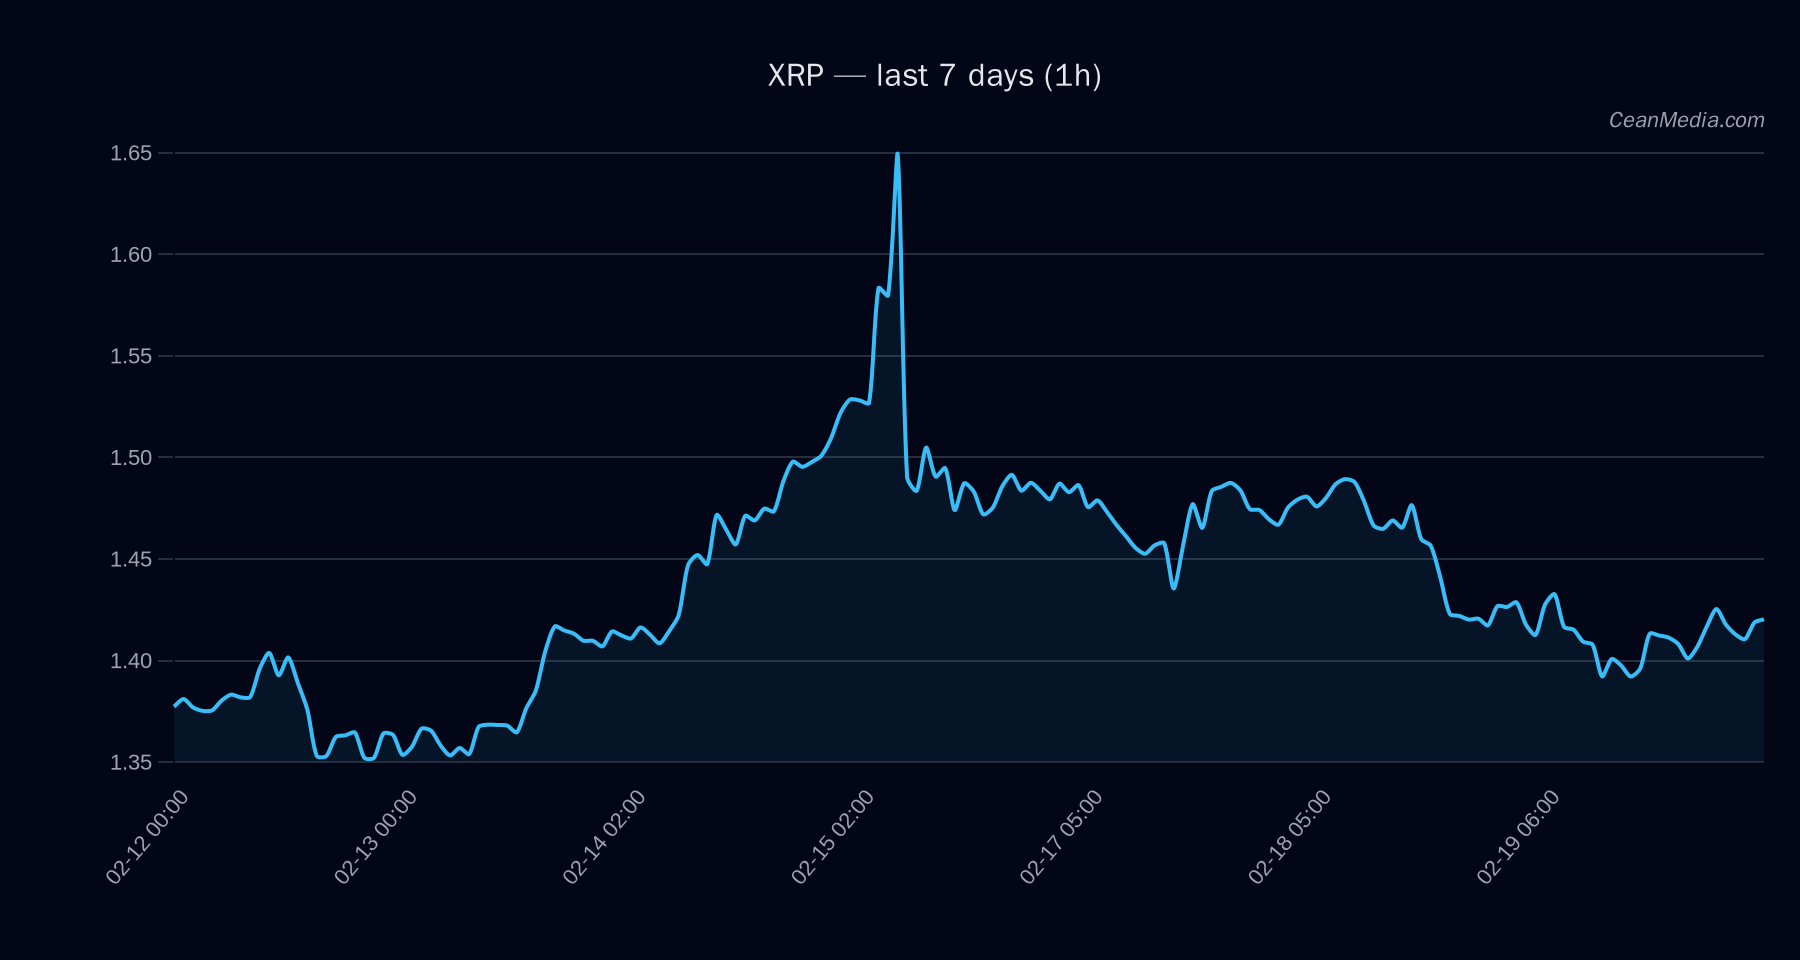
Current price (XRP): 1.4209. The market is showing a short-term forecast leaning to the downside (54%) with a sideways fundamental signal overall. Volatility regime is described as Very Low, with RSI near neutral at 52. Price bands indicate a near-term support near 1.40 and resistance near 1.44, with a major resistance around 1.56. The P50 level sits at 1.4085, and the band from P20 to P80 spans 1.3692 to 1.487.
Technical Analysis: XRP
- Support (Major): 1.38
- Support (Near): 1.40
- Resistance (Near): 1.44
- Resistance (Major): 1.56
Vol regime is Very Low; RSI at 52 indicates neutral momentum. Price action remains confined between the 1.40 support and 1.44 resistance in the near term. DOWN with 53.6% probability; Up probability 37.1%; Sideways 9.3%.
Drivers
- Return 24H: +0.44%
- EMA Slope: +0.0007
- Funding Z-Score: +1.02
- Basis Z-Score: -0.19
- Order-book Imbalance (EMA5): -0.05
- BTC Return 24H: +1.37%
- BTC Vol Regime: -1
- BTC Trend Strength: 0.69
ETF Flows (BTC/ETH)
Context: ETF flow data is provided strictly for BTC and ETH and is not used as a primary signal for XRP. The current ETF data suggests net outflows for BTC across 1D, 5D, and 10D horizons, while ETH shows notable 1D outflows as well. These figures reflect broader risk-on/off sentiment and liquidity dynamics in the crypto complex, which can influence market mood but should not be treated as XRP-specific signals.
- BTC ETF: 1D -$1.7M, 5D -$297.2M, 10D -$225.9M (net outflows)
- ETH ETF: 1D -$27.3M, 5D -$126.7M, 10D -$136.2M (net outflows)
What to Watch Next
- Watch for a close above 1.44 to confirm upside bias toward 1.4783–1.5073 in the near term.
- Monitor a break below 1.40 to assess potential move toward 1.3646–1.3368.
- Observe macro and BTC/ETH flow context for shifts in risk sentiment, keeping ETF data as contextual input rather than XRP-specific signals.
- Keep an eye on RSI drift and volatility changes, which could precede a break of the current range.
Hashtags: #XRP #CryptoTechnicalAnalysis #TradingView #CryptoMarkets #BTCFlows #ETHFlows #MarketOutlook #PriceAction #RSI #EMASlope #Volatility #MarketSignals