Market Snapshot
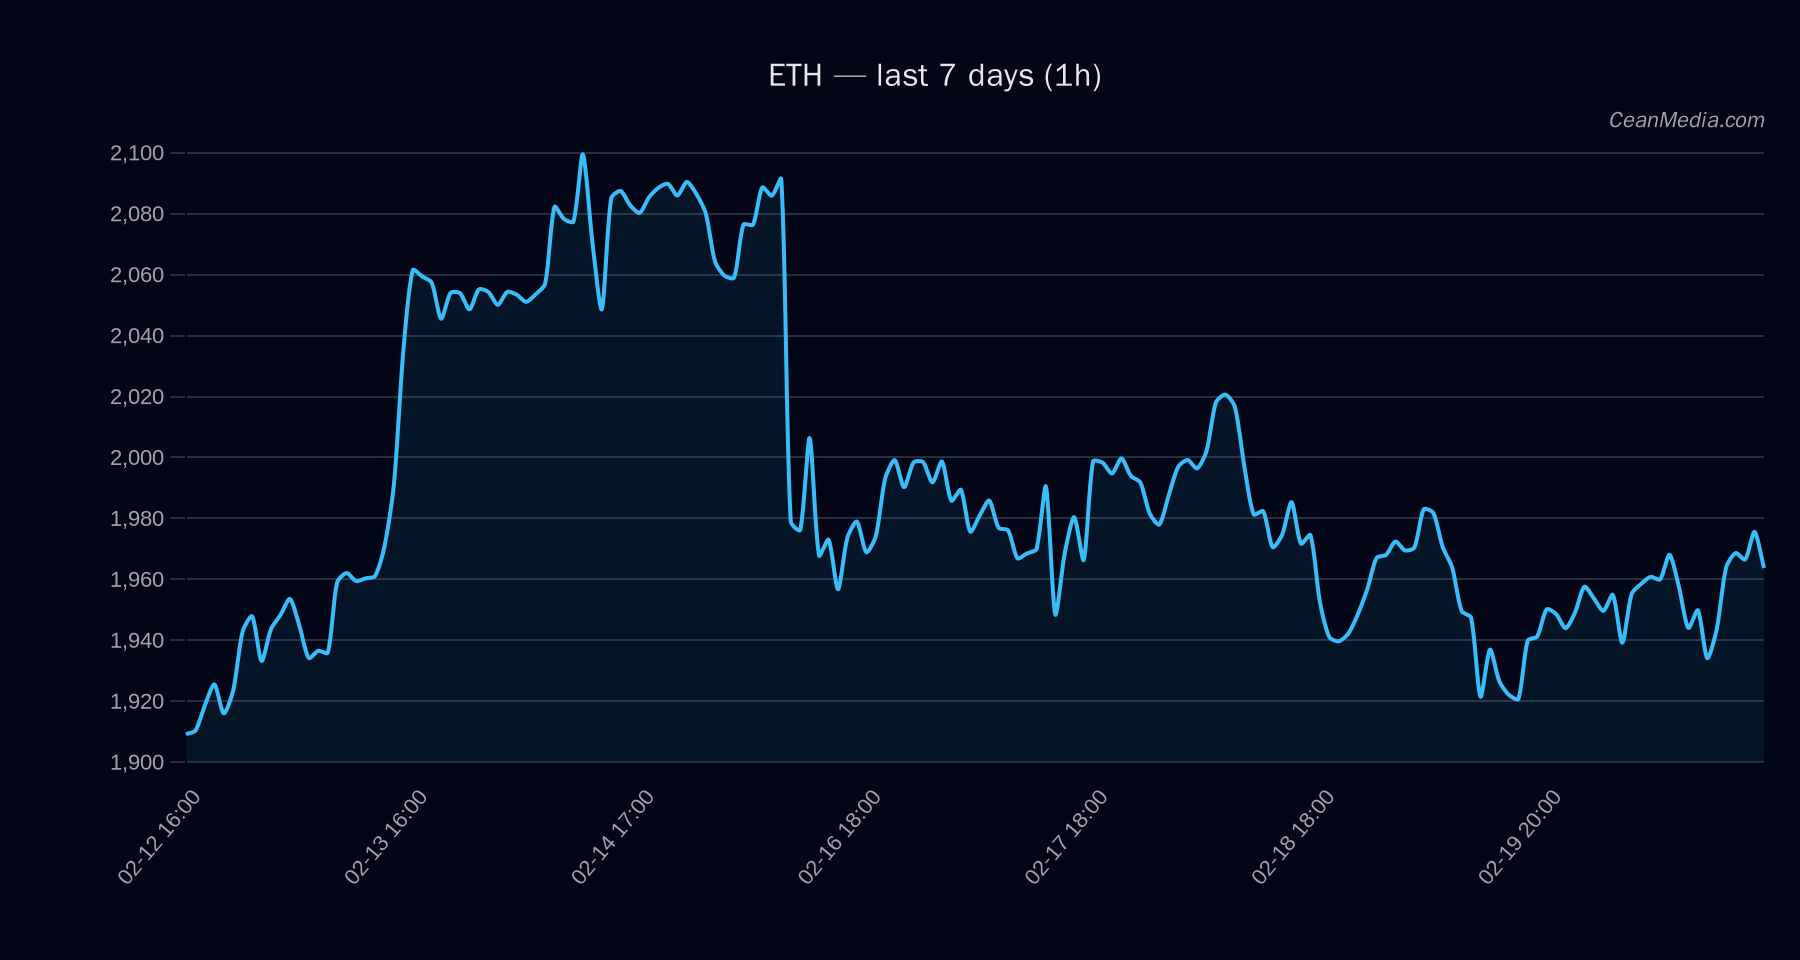
ETH trades around key support and resistance levels, with a price near 1,965.46 as of the latest reading. The near-term bias is cautious with a lean toward downside, while broader indicators show a sideways to modestly neutral posture. Market breadth is positive in the short term for ETH, and BTC/ETH ETF flow data provide contextual backdrop rather than a direct trading signal for ETH itself.
Technical Analysis: ETH
1,965.46; Band (P20–P80): 1,951.10 – 2,064.62 Down (51%); TA: sideways with mixed signals EMA12 > EMA26, SMA50 < SMA200 Major support 1,944; Near support 1,926; Major resistance 2,090; Near resistance 2,004 Upside if 1h close > 2,004 → 2,044.86 – 2,084.96; Downside if 1h close < 1,926 → 1,887.63 – 1,849.10 Up 38% | Sideways 11% | Down 51% Return 24h: 0.01; EMA slope: 0.0004; Funding z-score: -0.82; Basis z-score: 0.77; OB/EMA5: 0.07
Summary: ETH sits between 1,926 and 2,004, with a breakdown above 2,004 guiding toward the 2,045–2,085 zone, while a break below 1,926 opens a path toward around 1,887–1,849. Overall, the setup is cautiously bearish with sideways tendencies given current EMA relationships and RSI in neutral territory.
Drivers
- Return over the last 24 hours: modest at 0.01
- EMA slope: mild positive directional tilt (0.0004)
- Funding z-score: negative (-0.82) indicating modest funding pressure
- Basis z-score: positive (0.77) indicating deviation from moving averages
- Order-book imbalance (EMA5): 0.07
- BTC 24h return: 0.88%
- BTC volatility regime: extremely low / flat
- BTC trend strength: 0.40
Context notes: Market breadth for ETH-specific sentiment is favorable in the short term, but overall momentum remains muted amid low volatility. The combination of modestly negative funding pressure and neutral RSI supports a wait-and-see stance near current prices.
ETF Flows (BTC/ETH)
Contextual backdrop: ETF flow data shown below cover BTC and ETH only. These figures reflect fund-level flows and are not a primary signal for ETH price action. They should be interpreted as risk-on/off sentiment signals at a higher macro level rather than direct drivers of ETH price movements.
- BTC ETF: 1D -$165.8M; 5D -$461.3M; 10D -$390.0M
- ETH ETF: 1D -$124.1M; 5D -$223.5M; 10D -$233.0M
Interpretation: Ongoing ETF outflows in both BTC and ETH suggest a cautious risk-off stance among some institutional investors over recent periods. However, the ETH figures are modest relative to BTC, and ETF data should be considered as supplementary context rather than a leading signal for ETH price direction.
What to Watch Next
- Watch for a sustained close above 2,004 to validate upside targets toward 2,045–2,085.
- Monitor a break below 1,926 for potential acceleration toward 1,887–1,849.
- Monitor RSI behavior around neutral territory for any shift toward bullish or bearish momentum.
- Keep an eye on BTC ETF flows as macro risk-on/off context, recognizing they are not primary ETH signals.
Hashtags: #ETH #Ethereum #CryptoTrading #TechnicalAnalysis #ETFFlows #MarketStructure #PriceAction #Liquidity #Momentum #RiskManagement #Blockchain