Market Snapshot
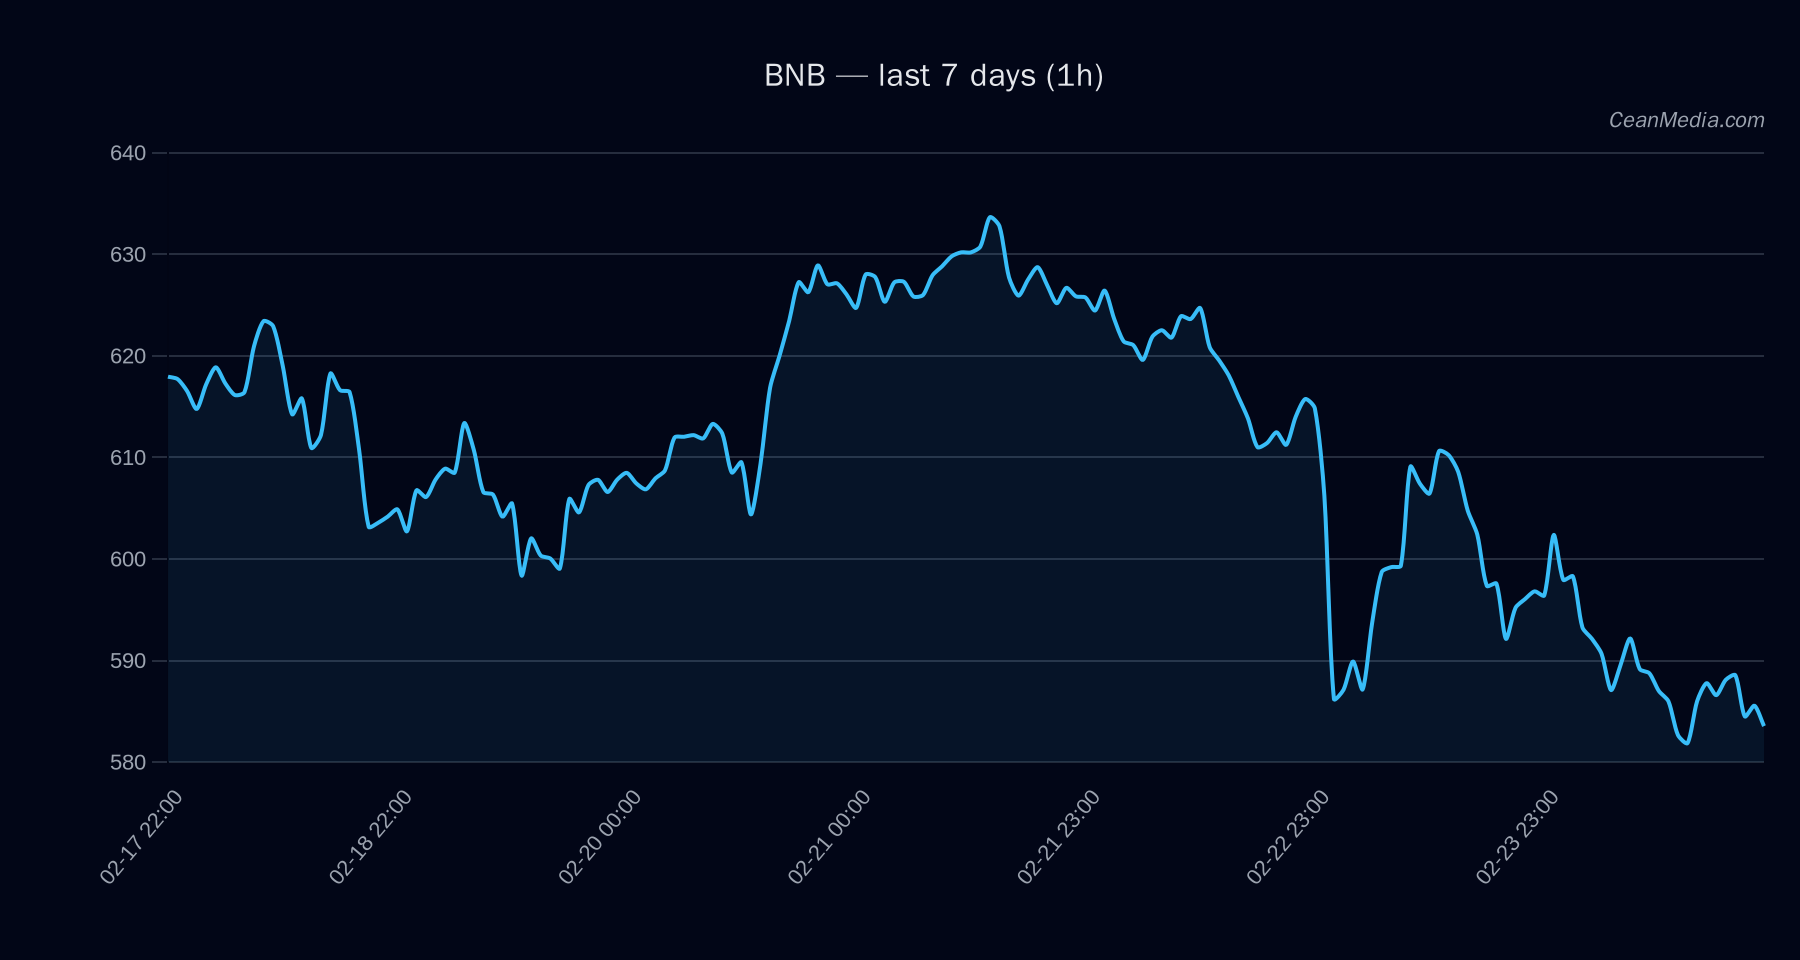
On 2026-02-25, BNB traded near the 586–610 range with a price around mid-590s. The market environment shows very low volatility and mixed short-term signals, with momentum indicators hovering near neutral. ETF flow data provided below relates to BTC and ETH and is presented for context only and not as a primary signal for BNB trading decisions.
Technical Analysis: BNB
: ~598.16 (as of the referenced forecast snapshot). : - EMA12 < EMA26
- SMA50 < SMA200
- RSI around 59 (neutral leaning mid-range)
- Volatility: σ24h ≈ 0.63% (Very low regime)
: - Major Support: 598; Near Support: 586
- Major Resistance: 638; Near Resistance: 610
: - Upside trigger: 1h close > 610 → target range roughly 622.33 to 634.53
- Downside trigger: 1h close < 586 → target range roughly 574.47 to 562.75
Drivers
- Top drivers (24h): Return -2.15%, EMA slope -0.00093, Funding z-score -0.35, Basis z-score +0.06
- Order-book imbalance (EMA5): +0.02
- BTC return (24h): -0.91%
- BTC volatility regime: 0 (neutral)
- BTC trend strength: 0.39
- Other contextual factors include overall breadth signals (>50h breadth 100%), and a very low vol regime for BTC/BNB context.
ETF Flows (BTC/ETH)
Contextual note: ETF flow data here covers BTC and ETH only and should not be treated as a primary signal for BNB. The data can inform risk-on/risk-off mood in the broader crypto market environment.
: 1D -$203.8M; 5D -$315.8M; 10D +$99.9M : 1D -$41.5M; 5D -$144.6M; 10D -$166.4M
Interpretation: The negative near-term BTC ETF flows suggest a cautious or risk-off tilt in the immediate horizon. This context may influence broader sentiment, but it is not a direct signal for BNB and should be weighed alongside BNB-specific technicals and on-chain signals.
What to Watch Next
- Watch for a close above 610 to activate upside targets toward 622–634.
- Monitor for a break below 586 to validate the downside range toward 574–563.
- Keep an eye on EMA12 vs EMA26 cross and SMA50 vs SMA200 alignment as near-term directional cues.
- Assess BTC/ETH ETF flow shifts as a contextual risk-on/off gauge, while not treating them as primary drivers for BNB.
Hashtags: #BNB #CryptoAnalysis #TechnicalAnalysis #ETFFlows #BTC #ETH #MarketSnapshot #TradingStrategy #CryptoNews