Market Snapshot
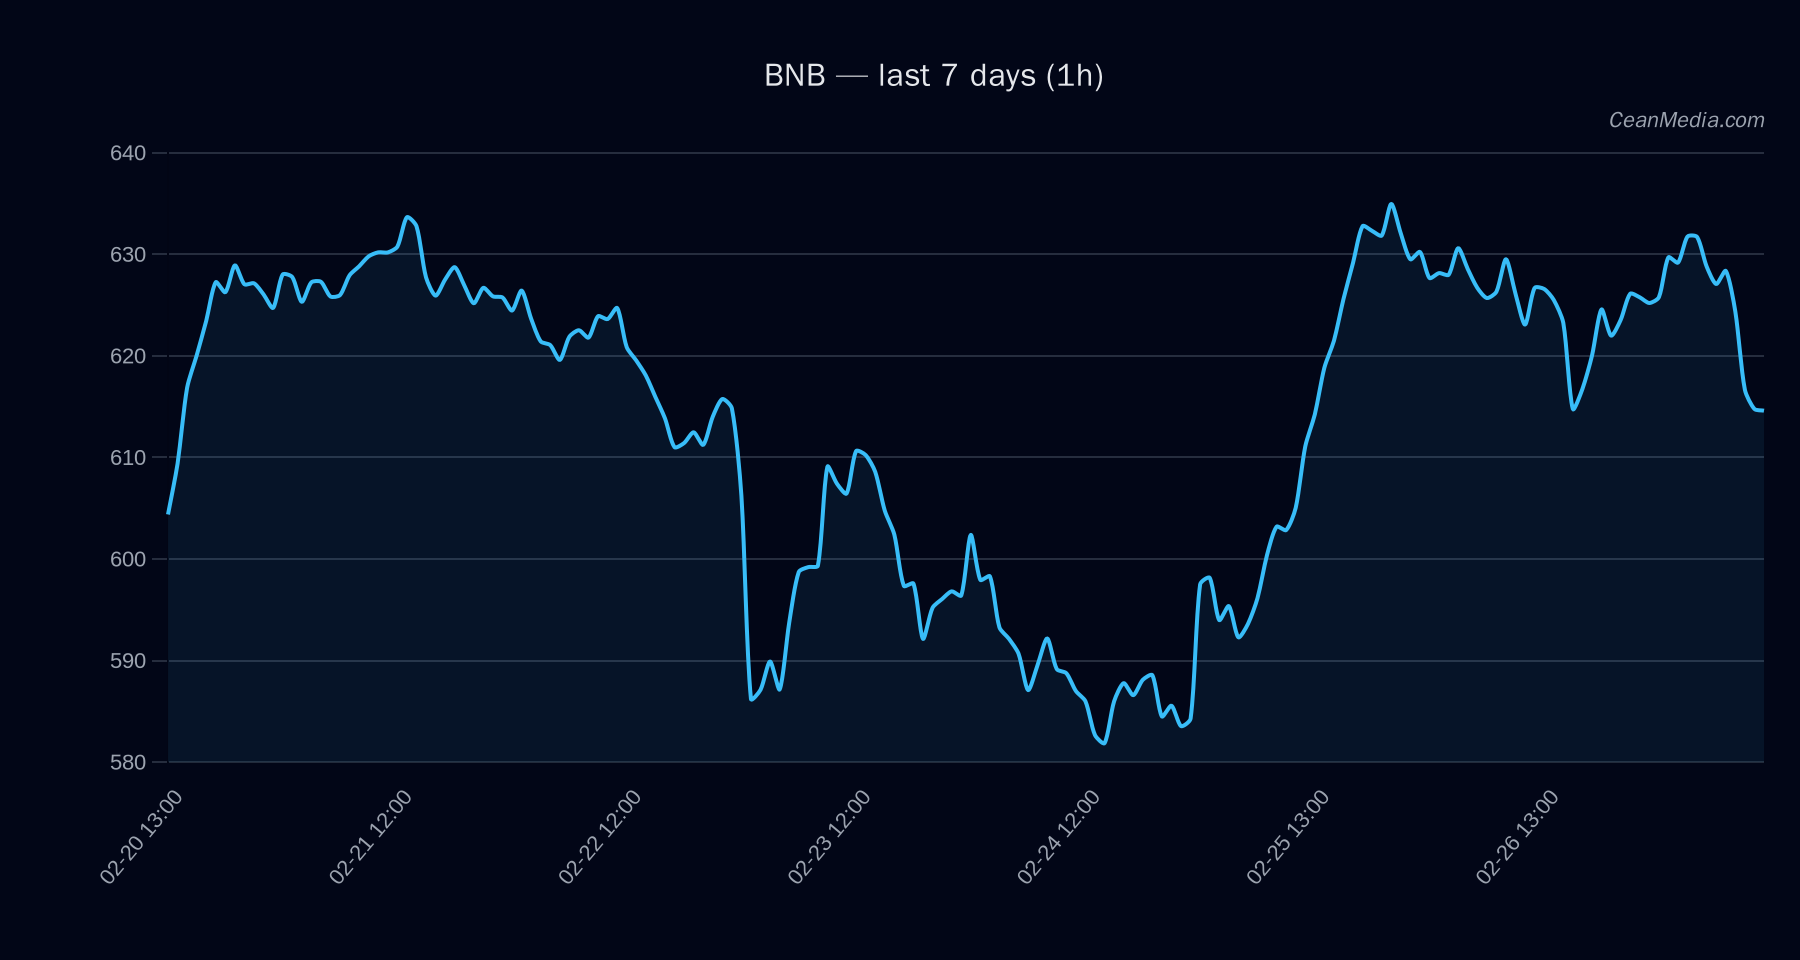
BNB is trading around the 614.61 level with a short-term forecast biased to downside (probability 50.2% for downward move). The current price sits between a near-term support at 602 and a near-term resistance at 627, with a major resistance at 632 and major support at 596. Band width indicates a relatively tight trading range after a period of low volatility.
Technical Analysis: BNB
- Price: 614.61
- Short-Term Forecast: Down (50.2%)
- Probabilities: Up 37.8%, Sideways 12.0%, Down 50.2%
- Indicators: EMA12 < EMA26, SMA50 > SMA200, RSI 36, σ24h 0.51%, Very low volume regime
- RSI: 36 (neutral lower-bound)
- Key Levels:
– Support → Major: 596, Near: 602
– Resistance → Major: 632, Near: 627 - Upside Trigger: 1h close > 627 → 639.44 – 651.98
- Downside Trigger: 1h close < 602 → 590.27 – 578.23
- Band (P20–P80): 600.65 – 633.52
Context: Breadth>50h: 0%, BTC-D dominance: 56.1% (slightly down over 7d), F&G (Fear) reading at Extreme Fear, and overall volatility regime labeled as Very Low. The momentum signals show a marginal negative drift with a subdued risk environment.
Drivers
- Return 24H: -0.02
- EMA Slope: -0.0023
- Funding Z-Score: 0.03
- Basis Z-Score: -0.73
- Order-Book Imbalance (EMA5): 0.09
- BTC Return 24H: -0.03
- BTC Vol Regime: 0
- BTC Trend Strength: 1.40
ETF Flows (BTC/ETH)
Context: ETF flows are presented for BTC and ETH only and should be interpreted as market breadth context rather than a primary signal for BNB. BTC ETFs show positive intraday and multi-day inflows, indicating broader risk-on appetite, while ETH ETFs show a marginal mixed signal. These flows reflect macro risk sentiment and capital allocation tendencies rather than direct drivers of BNB price action.
- BTC ETF 1D +$254.4M | 5D +$511.1M | 10D +$49.8M
- ETH ETF 1D -$0.5M | 5D +$126.9M | 10D -$96.6M
What to Watch Next
- Monitor price action near 602 for potential test of near-term support; a break below could open 590–578 in the downside scenario.
- Watch for a close above 627 to confirm a potential push toward 639–652 range.
- Keep an eye on volume regime: Very low volatility environments can precede sharper moves if price breaks key levels.
- Consider the broader market context from BTC/ETH ETF flows as a secondary gauge of risk sentiment, not a primary signal for BNB.
Hashtags: #BNB #CryptoMarkets #TechnicalAnalysis #ETFFlows #BTC #ETH #MarketSnapshot #SupportResistance #RSI #EMA