Market Snapshot
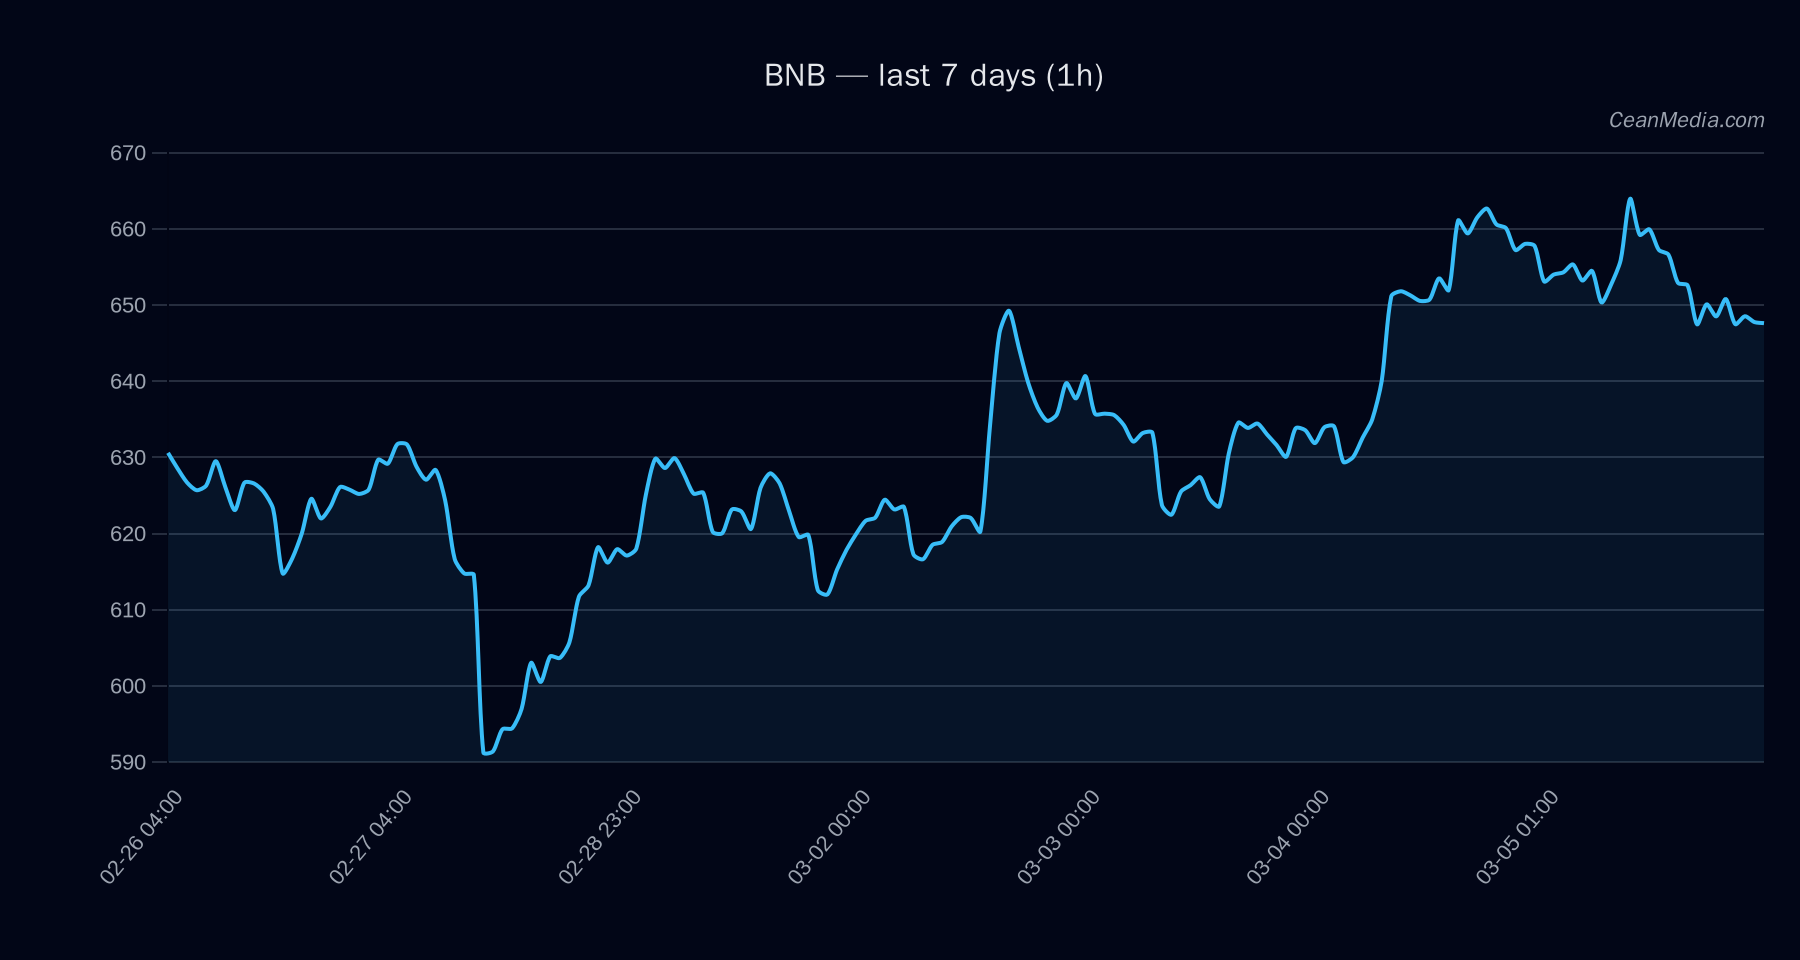
BNB trades around the mid-650s with a near-term bias skewed to the downside. The asset remains confined between key technical levels: support at 638 (near) and 616 (major) and resistance at 647 (near) and 664 (major). Recent price action shows a bearish tilt embedded in the short-term forecast, but the range remains orderly with very low volatility regime and mixed momentum signals.
Technical Analysis: BNB
- Current price: 650.98
- Short-Term Forecast: Down (48%) with a notable probability split: Up 43%, Side 9%.
- Key indicators: EMA12 < EMA26, SMA50 > SMA200, RSI 49, volatility (σ24h) 0.48%, vol regime: Very low.
- RSI: Neutral (49).
- Support / Resistance: Major support 616; near support 638. Major resistance 647; near resistance 664.
- Price bands: P20–P80: 634.13 – 678.55; P50 (mid): 658.49; observed price sits around 651.
- Forecast triggers: Upside if 1h close > 664 (target range 677.28 to 690.56). Downside if 1h close < 638 (target range 625.20 to 612.44).
- Contextual momentum: Trend indicators show a mild negative slope; overall breadth and BTC-related metrics provide cross-asset context but do not override primary TA for BNB.
Drivers
- Return 24H: -0.02
- EMA Slope: -0.0008
- Funding Z-Score: -1.60
- Basis Z-Score: -0.27
- Order-book Imbalance (EMA5): -0.02
- BTC Return 24H: -0.02
- BTC Vol Regime: 0
- BTC Trend Strength: 0.95
ETF Flows (BTC/ETH)
The ETF flow context is provided for BTC and ETH only. Flows are positive in the recent windows, indicating incremental demand in BTC and ETH ETFs. This data should be treated as a market-wide risk-on/off mood indicator rather than a direct signal for BNB-specific movements. Use as supplementary context to gauge broader market liquidity and sentiment when assessing cross-asset risk appetite.
- BTC ETF: +$155.3M (1D), +$480.0M (5D), +$570.9M (10D)
- ETH ETF: +$149.2M (1D), +$84.0M (5D), +$87.3M (10D)
What to Watch Next
- Monitor 1h close relative to 664 (bullish trigger) for potential upside re-target to 677–691.
- Watch 1h close below 638 (bearish trigger) to anticipate continuation toward 625–612.
- Keep an eye on BTC trend strength and ETF flow momentum as corroborating signals for overall market risk-on/off posture.
- Vol regime remains very low; expect range-bound behavior unless a decisive breakout occurs.
Hashtags: #BNB #BinanceCoin #CryptoAnalysis #TechnicalAnalysis #ETFFlows #BTC #ETH #MarketSnapshot #MarketAnalysis
Note: ETF data here reflects BTC and ETH flows and should be considered contextual rather than a primary signal for BNB trading decisions.