Market Snapshot
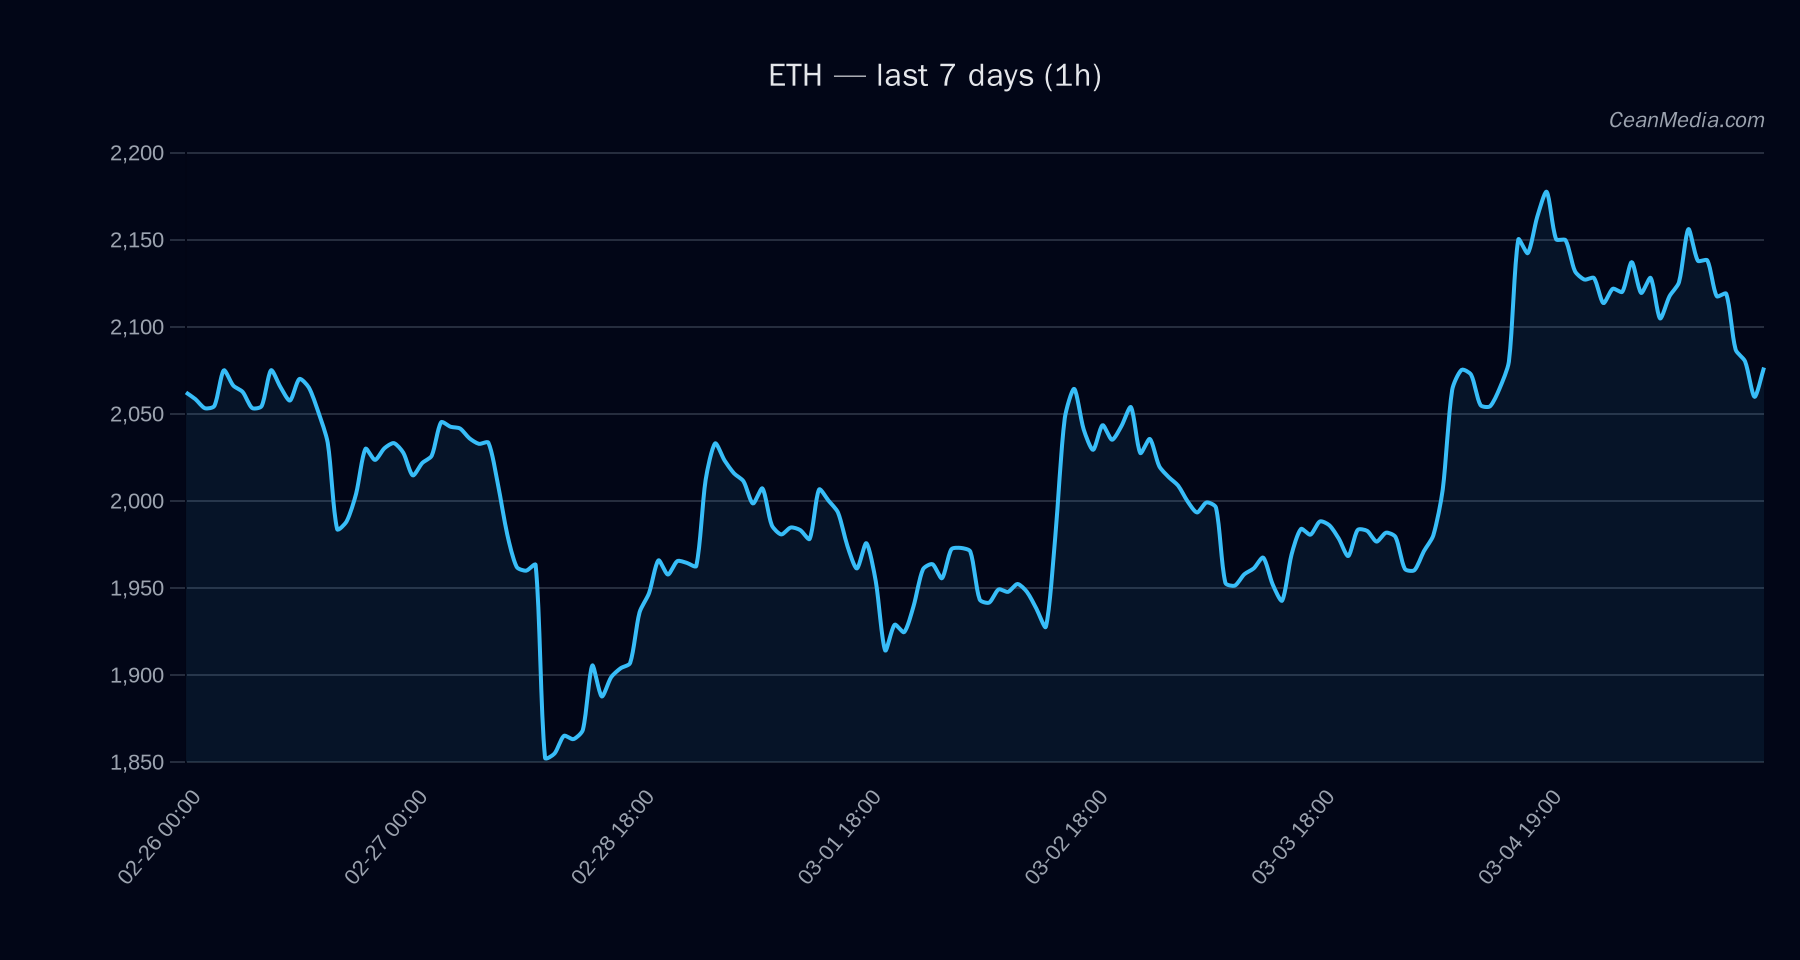
Ethereum (ETH) remains range-bound between 2,032 support and 2,116 resistance on the latest short‑term view. The instrument shows a cautious tilt with a 50% probability of upside on the next move, while downside expectations sit around 45% in the near term. Key band: P20–P80 at 2,015.21 to 2,191.38; Major support at 1,868 and major resistance at 2,072. Upside continuation beyond 2,116 could target 2,157.76–2,200.07; breakdown below 2,032 could expose 1,991.84–1,951.19.
Technical Analysis: ETH
- Up (50%), with sideways TA backdrop indicated by EMA12
SMA200; RSI at 43 (neutral). -
- Near-term support: 2,032
- Major support: 1,868
- Near-term resistance: 2,116
- Major resistance: 2,072
- If 1h close > 2,116, potential move to 2,157.76–2,200.07. If 1h close < 2,032, potential move to 1,991.84–1,951.19.
- Very low volatility regime (σ24h ~0.75%).
- Close above 2,116 or break below 2,032 to confirm directional bias.
- A move outside established bands without clear follow-through or a sustained close beyond the immediate trigger would invalidate the short‑term directional bias.
Drivers
- Top momentum factors include: 24h return (-0.04%), EMA slope (-0.0021), and funding z-score (-0.22).
- Order-book imbalance (EMA5) stands at 0.43, suggesting modest buying pressure.
- BTC correlation and regime: BTC 24h return -0.04%, vol regime 0, trend strength ~1.34; overall context indicates cautious risk-on/off dynamics rather than a clear ETH-led breakout.
- Additional metrics: distance from MA ~0.71% above a moving-average baseline; drawdown 30d ~-31.7%; spread metrics modest (spread_bp ~0.048, spread_z ~-1.23).
ETF Flows (BTC/ETH)
ETF flow data provided here is limited to BTC and ETH, serving as market-context indicators rather than primary trading signals for ETH. BTC ETF flows show solid positive backing: +$155.3M in 1D, +$480.0M in 5D, and +$570.9M in 10D. ETH ETF flows are positive as well: +$149.2M in 1D, +$84.0M in 5D, and +$87.3M in 10D. These figures can reflect broader risk-on appetite and institutional participation, but should not be used in isolation to infer ETH price direction.
What to Watch Next
- Watch for a daily close above 2,116 to validate potential upside toward 2,157–2,200.
- Monitor 2,032 as a near-term critical support; a break below could accelerate toward 1,991–1,951.
- Observe ETF flow momentum in BTC as a contextual signal for overall risk sentiment, recognizing its non-primary role for ETH trading decisions.
- Keep an eye on volatility regime shifts; a move from very low to higher volatility could precede a breakout or a breakdown.
Hashtags: #ETHMarket #ETHTechnical #CryptoAnalysis #ETFFlows #BTCETHContext #CryptoStrategy #RiskOnOff #PriceLevels #SupportResistance #MarketSignal #TradingBias #ShortTermForecast