Market Snapshot
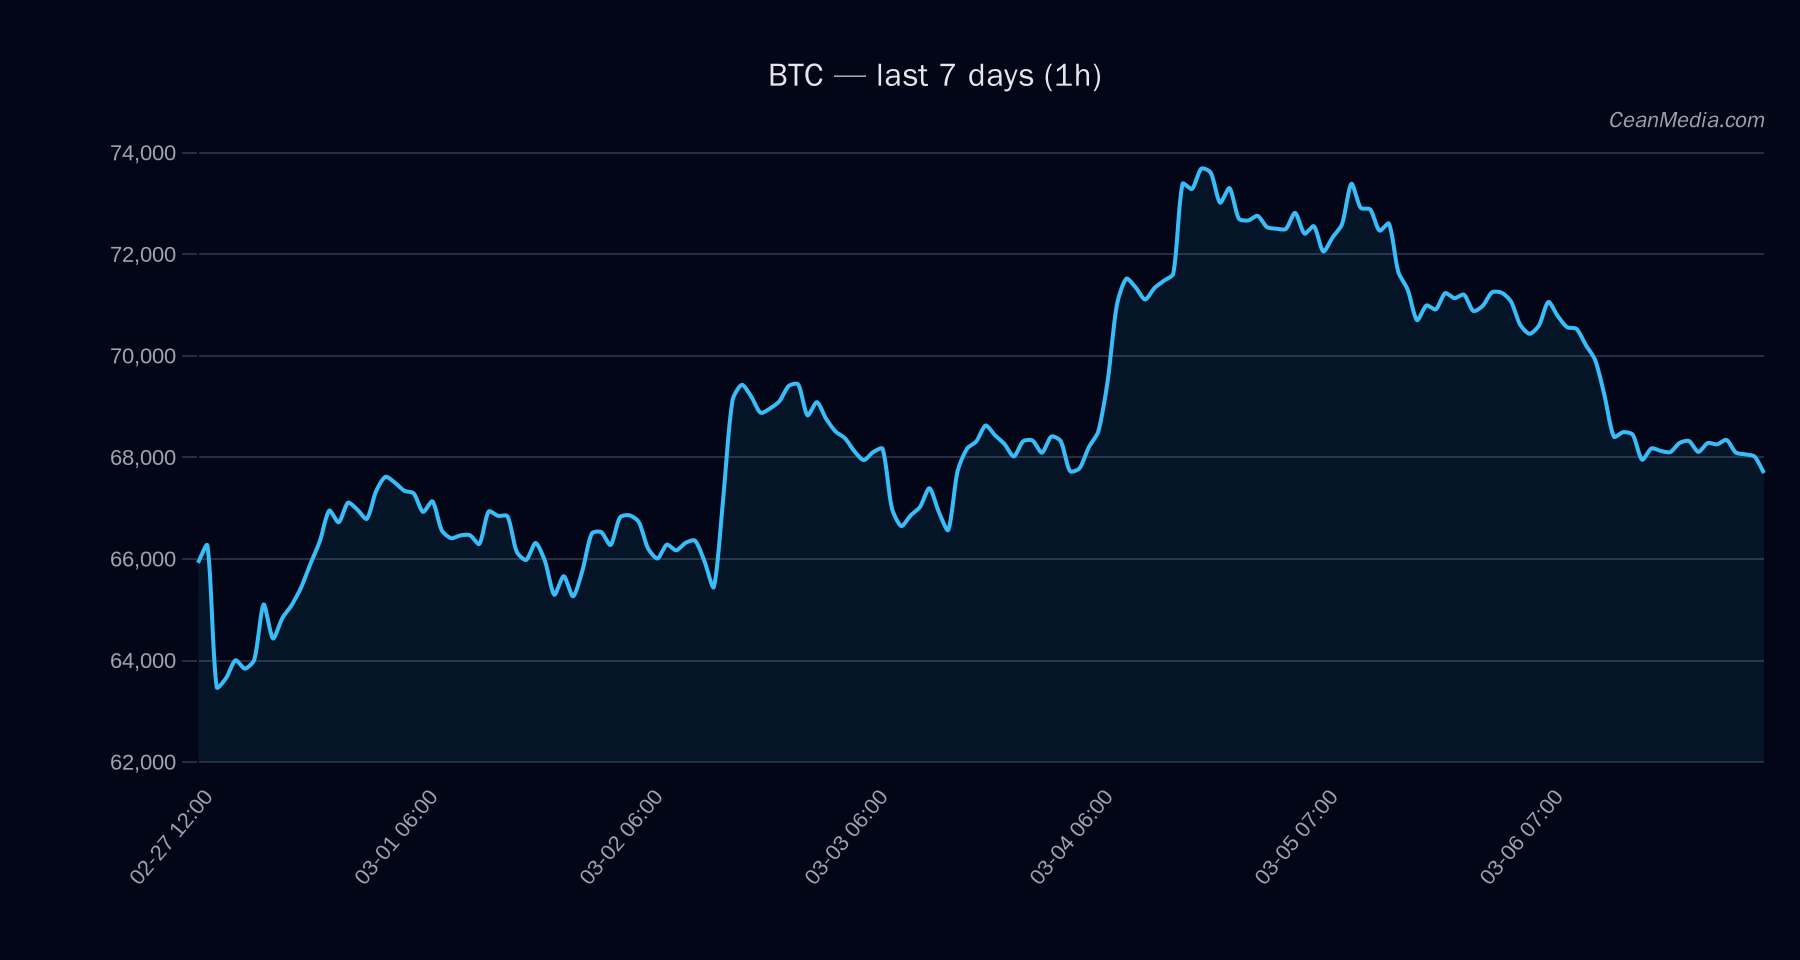
BTC is trading within a tight range between the near-term support at 66,275 and the resistance at 68,975. The key proximity levels suggest a potential breakout if 68,975 is cleared, targeting 70,357.82 to 71,737.39. Conversely, a break below 66,275 opens a path toward 64,947.76 and 63,622.30. The current bias is described as down with a sideways TA context, and RSI sits in oversold territory.
Technical Analysis: BTC
- : 67,625.74
- : down (50%) | Probabilities — Up: 41% | Sideways: 9% | Down: 50%
- : EMA12
- : 26 (oversold)
- : 68,237.97
- : 66,068.77 – 70,607.58
- : Major 64,825 | Near 66,275
- : Major 70,875 | Near 68,975
- : 1h close > 68,975 → 70,357.82…71,737.39
- : 1h close < 66,275 → 64,947.76…63,622.30
- : Breadth >50h 0%, ρ(BTC,72h) 1.00, Alt breadth ex-mega 0%, Vol regime Very low, F&G 12 (Extreme Fear), BTC.D 56.6% ↗ +0.5%/7d
Drivers
- Return 24H: -0.03
- EMA Slope: -0.0008
- Funding Z-Score: -1
- Basis Z-Score: -0.68
- Order-Book Imbalance (EMA5): 0.19
- BTC Return 24H: -0.03
- BTC Vol Regime: -1
- BTC Trend Strength: 1.67
ETF Flows (BTC/ETH)
Context: ETF flow data shown pertains to BTC and ETH. This information is a supplementary context and not a primary signal for BTC trading decisions. The data indicates BTC ETFs at -$205.4M for 1D, -$91.5M for 5D, and +$304.0M for 10D; ETH ETFs show -$86.7M (1D), -$82.5M (5D), and -$0.3M (10D).
What to Watch Next
- Monitor a close above 68,975 as a potential trigger for a move toward 70,357–71,737.
- Watch for a break below 66,275 to validate downside targets 64,947–63,622.
- Observe changes in RSI from oversold levels for potential short-covering or further downside risk.
- Stay aware of ETF flow shifts for BTC/ETH as contextual risk-on/off indicators, but rely primarily on price action and on-chain signals for BTC decisions.
Hashtags: #btc #cryptomarket #technicalanalysis #etfflows #blockchain #trading #markets #priceaction #riskmanagement #investing #crypto