Market Snapshot
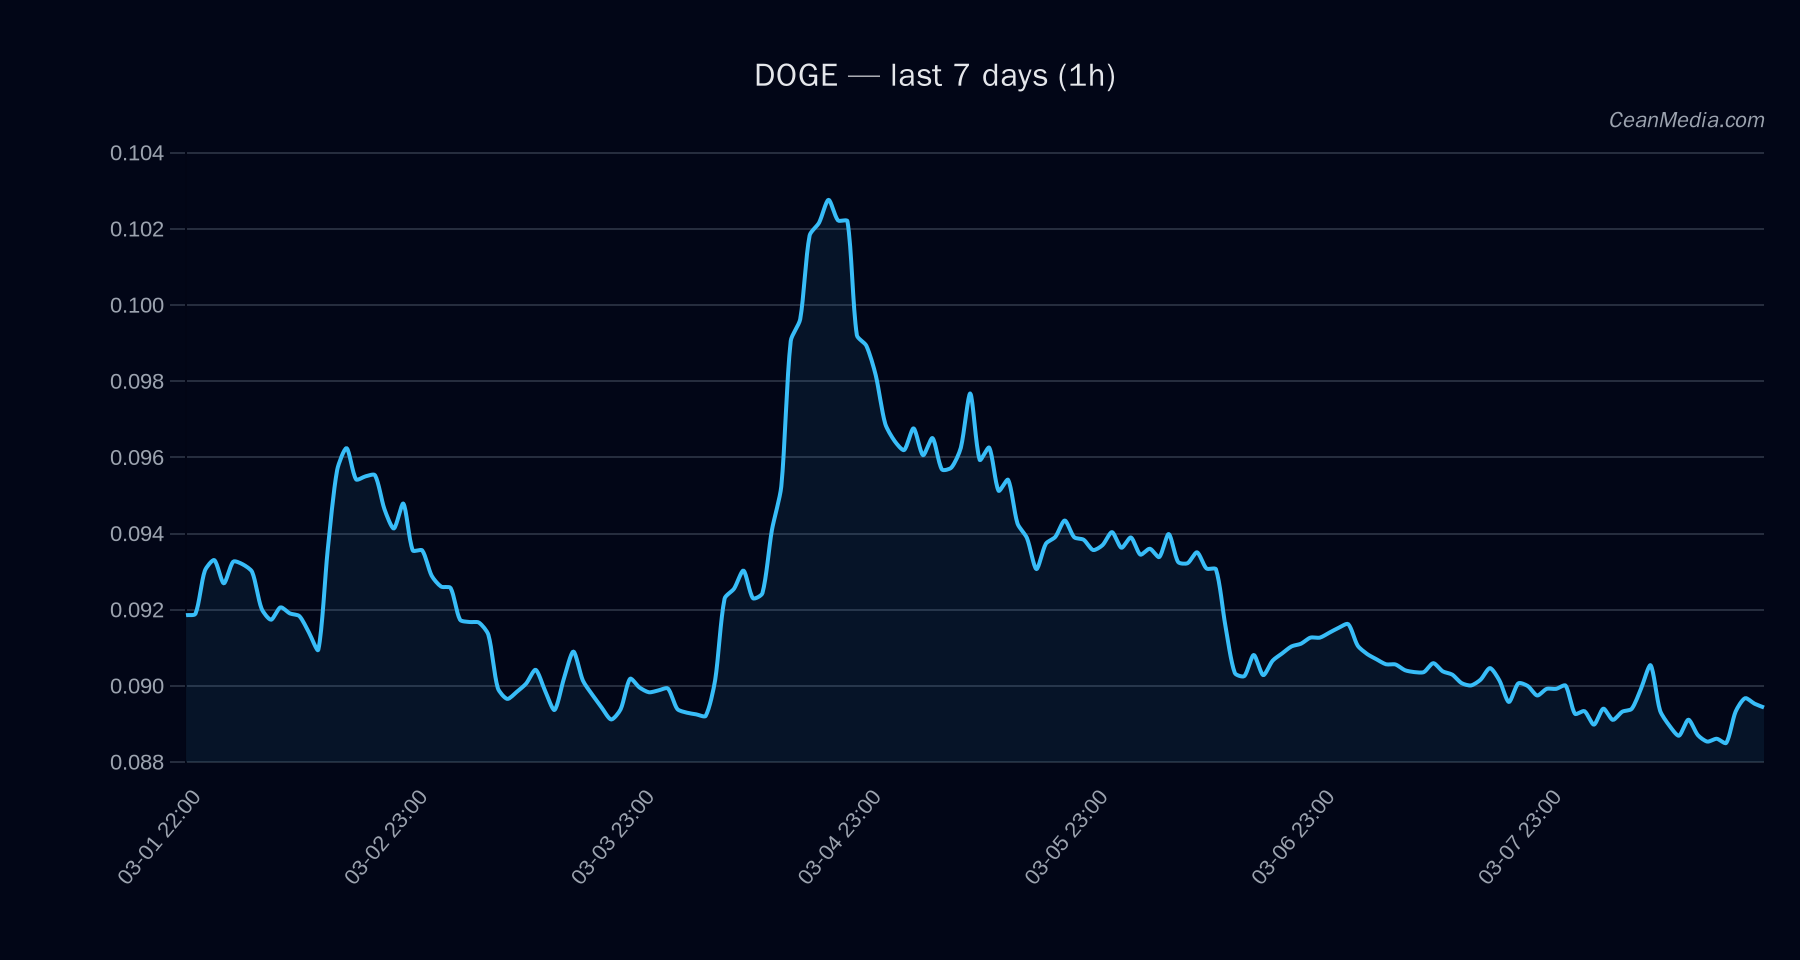
DOGE trades around the 0.09 area with a near-term range defined by support at 0.088 and resistance at 0.092. The current setup indicates a bearish bias on a 24-hour horizon, with probabilities skewed toward downside (Down: 58%, Up: 38%, Side: 4%). Volatility regime is described as Very low, and momentum indicators show a neutral RSI near mid-level (RSI 53). Key near-term trigger levels are a break above 0.092 (targeting 0.0934–0.0952) and a break below 0.088 (targeting 0.0862–0.0844).
Technical Analysis: DOGE
Short-term forecast is DOWN with a bearish tilt supported by EMA12 - Support (Major): 0.09
- Support (Near): 0.088
- Resistance (Near): 0.092
- Resistance (Major): 0.098
Break above 0.092 suggests upside to 0.0934–0.0952. Break below 0.088 suggests continuation toward 0.0862–0.0844. Forecast: down (58%) with TA indicating bearish signals (RSI neutral, very low volatility). 1h and 24h dynamics align with tighter price compression around the current range. The current breadth indicators show breadth over 50h at 0%, and the 72h BTC correlation is low (ρ(BTC,72h): 0.02). The overall macro backdrop includes extreme fear readings and modest BTC.D growth, which provides context but is not a primary driver for DOGE pricing on a tick-by-tick basis.
Drivers
Return: -0.0035; EMA slope: +0.0004; Funding z-score: -1.34; Basis z-score: -0.34; Order-book imbalance (EMA5): +0.033; BTC return 24h: -0.015; BTC trend strength: 0.701; Vol regime: Very low. Very low vol regime suggests compressive price action with limited intraday movement; RSI sits near neutral territory but overall trend is modestly negative per the forecast.
ETF Flows (BTC/ETH)
The ETF flow data provided covers BTC and ETH and is presented here as contextual information rather than a primary signal for DOGE. For BTC, 1D flow is -$348.9M, 5D is -$235.0M, and 10D is +$160.5M. For ETH, 1D flow is -$91.5M, 5D is -$87.3M, and 10D is -$5.1M. These figures suggest a near-term risk-off tilt in BTC price dynamics, which can influence altcoins indirectly through correlation and risk sentiment, but are not used as a standalone DOGE trading signal.
What to Watch Next
- Dogecoin breaks above 0.092 to test 0.0934–0.0952 resistance range.
- Dogecoin breaks below 0.088 to accelerate toward 0.0862–0.0844.
- Monitor BTC price action and the BTC ETF flow signals as a contextual risk-off reminder, not as a DOGE trigger.
- Solicit intraday volatility cues or macro catalysts that may re-center DOGE momentum beyond the current neutral RSI reading.
Hashtags: #doge #cryptomarket #ta #tradingview #altcoin #cryptoforecast #etfflow #btc #eth #riskon #marketanalysis