Market Snapshot
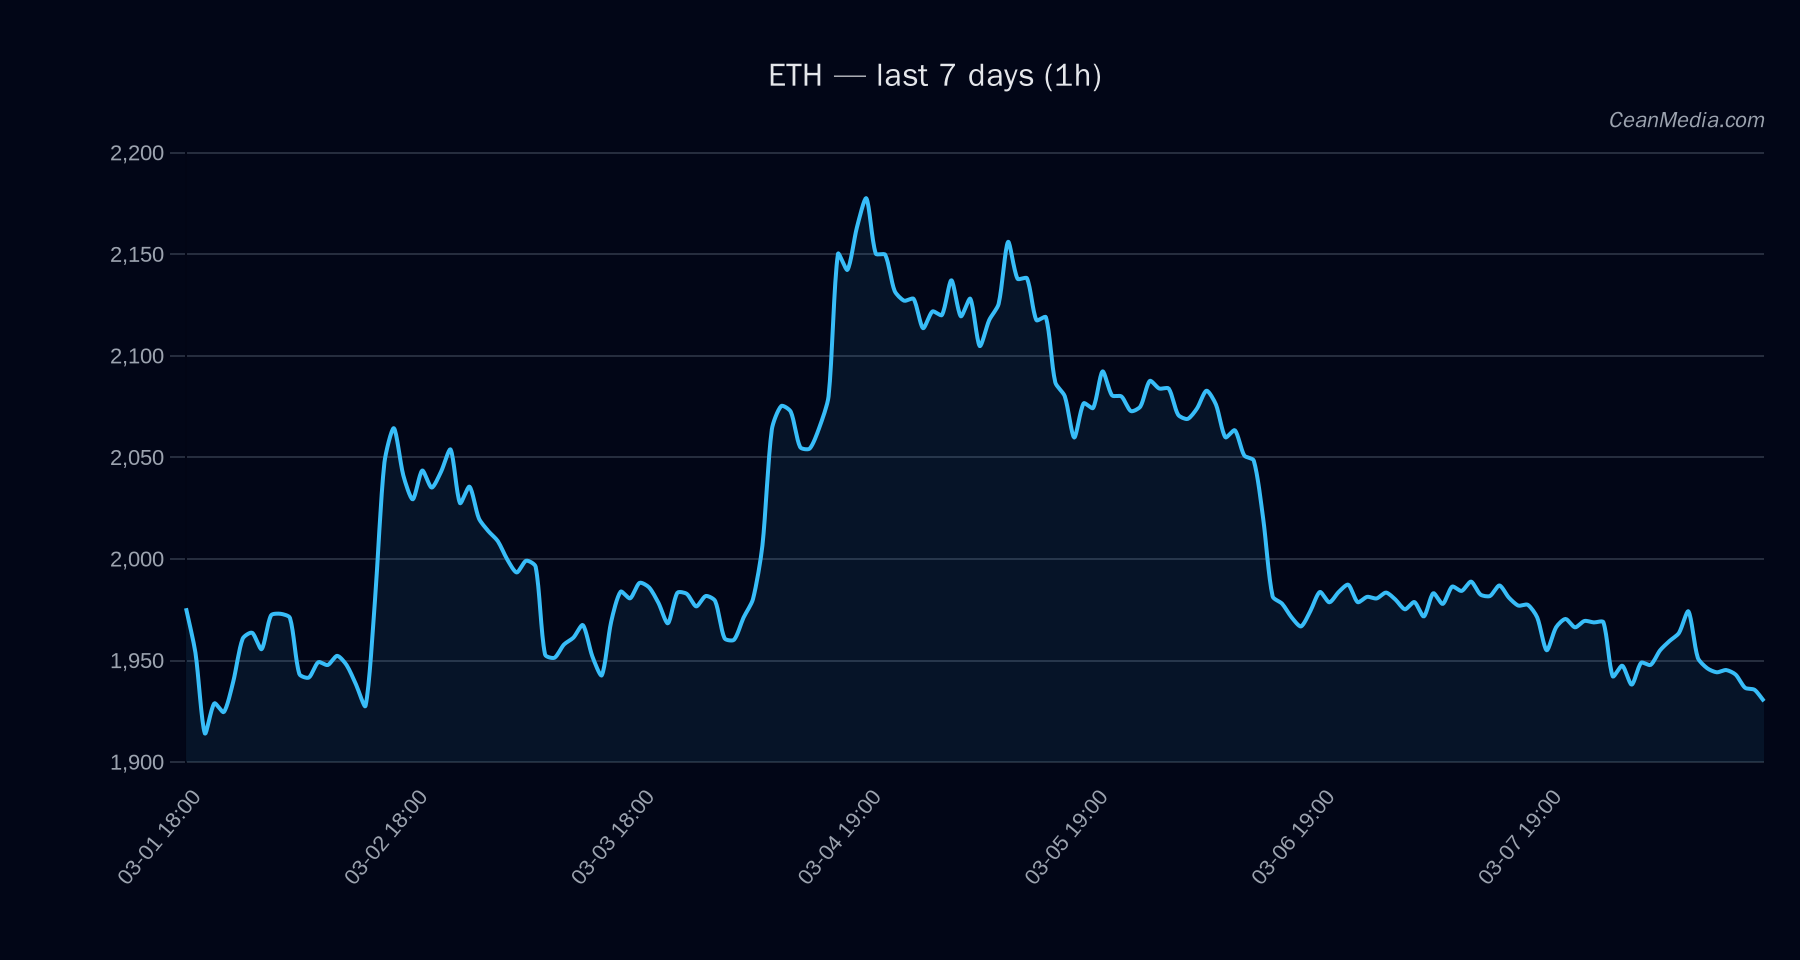
ETH is hovering near key levels with the price around the mid-1,900s. The immediate range sits between major support at 1,868 and near-term resistance at 2,046, with a closer resistance cue at 1,988. Short-term directional bias leans bearish with a probability of 57% for downside movement if the price breaks below 1,910, potentially extending to 1,870.96–1,832.78. The volatility regime is described as very low, and RSI sits around neutral at 45, indicating limited momentum at present. The proximity to the EMA/SMA cross-structure (EMA12 Contextual note: ETF flow data shown here covers BTC and ETH only. This information provides macro flow context and is not intended as a primary signal for ETH alone. Current signals indicate net negative ETF flows for BTC across 1D and 5D windows, with ETH showing modest outflows in 1D and 5D windows. However, these flows should be interpreted as one of multiple contextual inputs and not the sole driver for ETH pricing. Hashtags: #ETH #TechnicalAnalysis #MarketOutlook #ETFFlows #CryptoTrading #PriceAction #BTC #MarketContext #Volatility #Liquidity #RiskManagementTechnical Analysis: ETH
Drivers
ETF Flows (BTC/ETH)
What to Watch Next