Market Snapshot
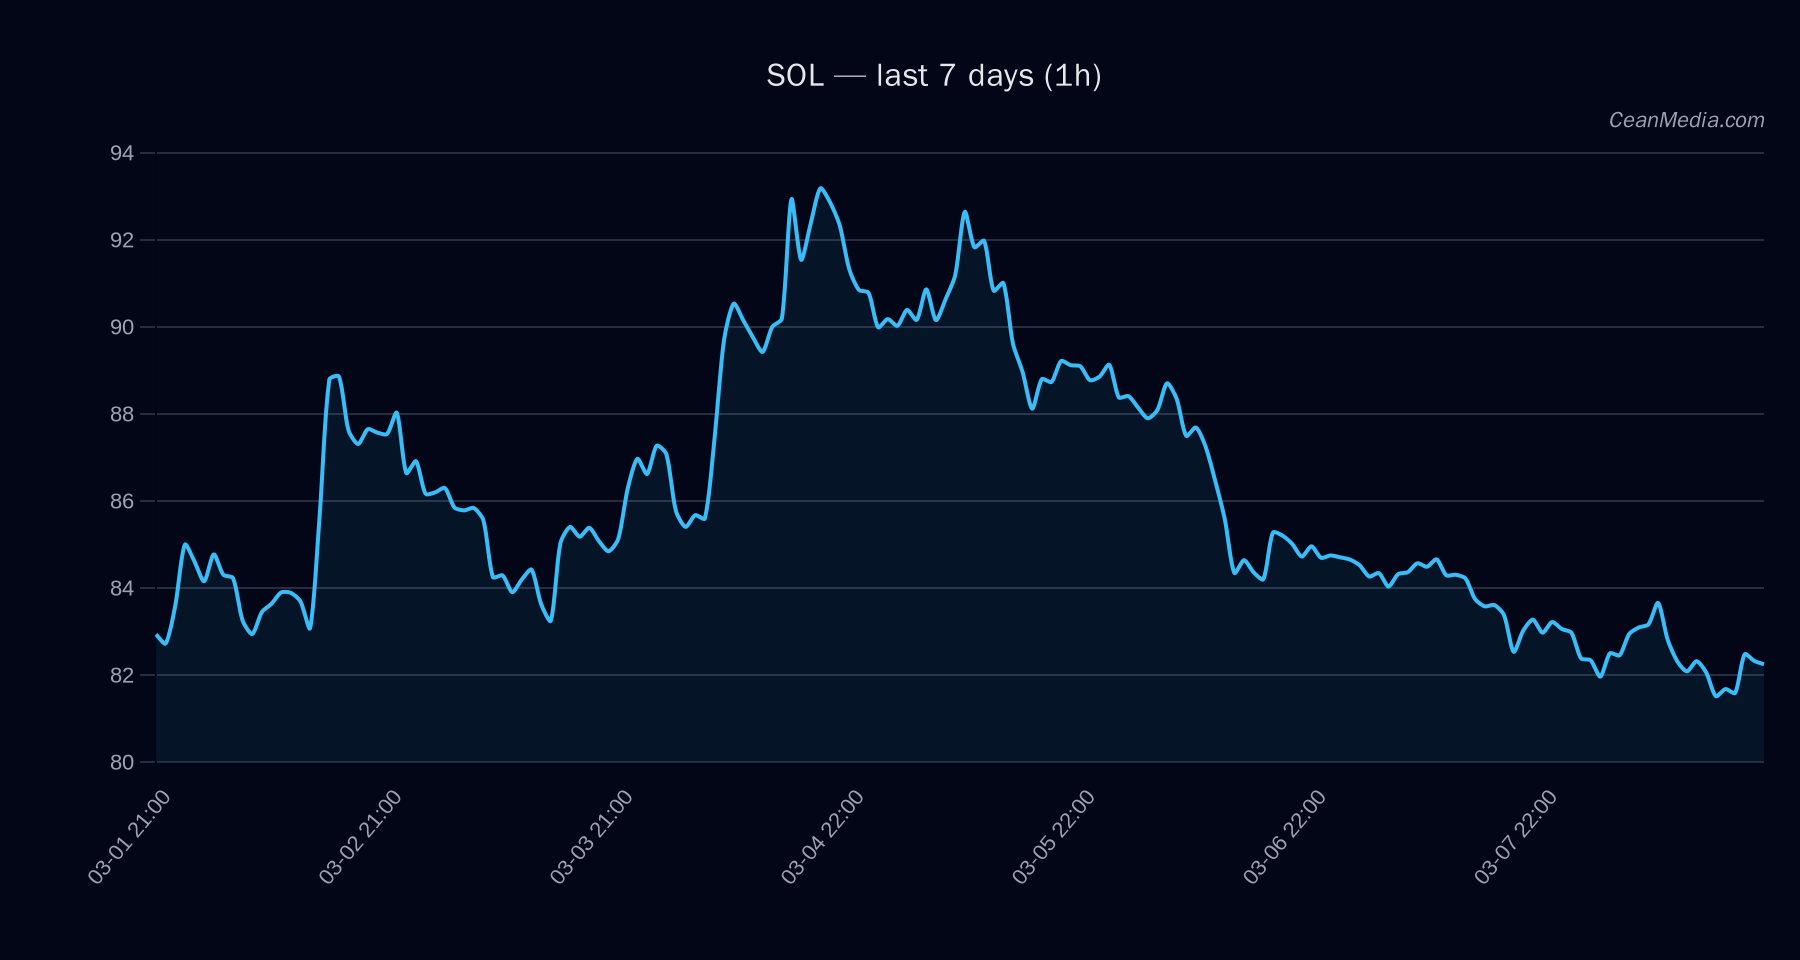
Solana (SOL) trades near key support and resistance levels with the short-term outlook biased to the downside. The current price is 82.25, with a near-term range defined by support ~79–80.6 and resistance ~83.9–87.3. Market breadth and volatility are subdued, with a very low volatility regime and mixed breadth indicators. ETF flow data provided here covers BTC and ETH markets and is intended as contextual information rather than a primary SOL signal.
Technical Analysis: SOL
- Price / Bias: 82.25 with a bearish short-term forecast (59% probability of a move lower).
- Key indicators: EMA12 < EMA26, SMA50 < SMA200, RSI 45 (neutral).
- Volatility / Regime: σ24h 0.48%, Vol regime: Very low.
- Support / Resistance: Major support at 79, near support 80.6; major resistance at 87.3, near resistance 83.9.
- Target triggers: Upside trigger: 1h close > 83.9 → 85.57–87.25; Downside trigger: 1h close < 80.6 → 78.99–77.38.
- Forecast (24h): Direction: DOWN, Confidence: ~58.7%, Range: 78.51–86.22 (P20–P80), P50 at 81.39.
- Invalidation / Bias Notes: Break above 83.9 would shift near-term bias to bullish realms; failure to hold 79 could accelerate downside toward 77.38.
Drivers
- Top factors: 24h return (-1.23%), EMA slope near zero, funding and basis z-scores negative (−1.31, −1.08 respectively).
- Other momentum indicators: OB-EMA5 imbalances modestly negative; BTC 24h return (-0.65%), BTC volatility regime weak (−1), BTC trend strength around 0.35. Overall breadth metrics are muted (Breadth >50h at 0%).
- Contextual note: Overall momentum remains cautious with limited upside pressure and subdued volatility.
ETF Flows (BTC/ETH)
The ETF flow data presented covers BTC and ETH and should be interpreted as contextual macro flow signals rather than direct SOL signals. BTC ETF flows show net negative signals recently: 1D -$348.9M, 5D -$235.0M, 10D +$160.5M. ETH ETF flows show 1D -$91.5M, 5D -$87.3M, 10D -$5.1M. These movements can reflect broader risk-on/off sentiment and liquidity shifts in correlated crypto markets but are not a direct predictor of SOL performance.
What to Watch Next
- Monitor SOL price movement relative to 80.6 and 83.9 to gauge potential breakout or breakdown triggers.
- Watch intraday closes above 83.9 to validate potential upside toward 85.6–87.3.
- Observe changes in BTC/ETH ETF flows and volatility regime as they may signal shifts in risk sentiment that could affect altcoins.
- Track EMA crossovers and RSI movement for any signs of momentum strengthening or deterioration.
Hashtags: #Solana #SOL #CryptoTrading #TechnicalAnalysis #ETFFlows #BTC #ETH #MarketOutlook #PriceAction #Altcoins #MarketRisk #Liquidity