Market Snapshot
On 2026-03-10, ADA traded around 0.2612 with a cross-market backdrop showing very low volatility and a mixed risk tone. BTC and ETH ETF flows show net positive one-day momentum for BTC, providing context for risk appetite but not serving as a primary ADA signal in this report.
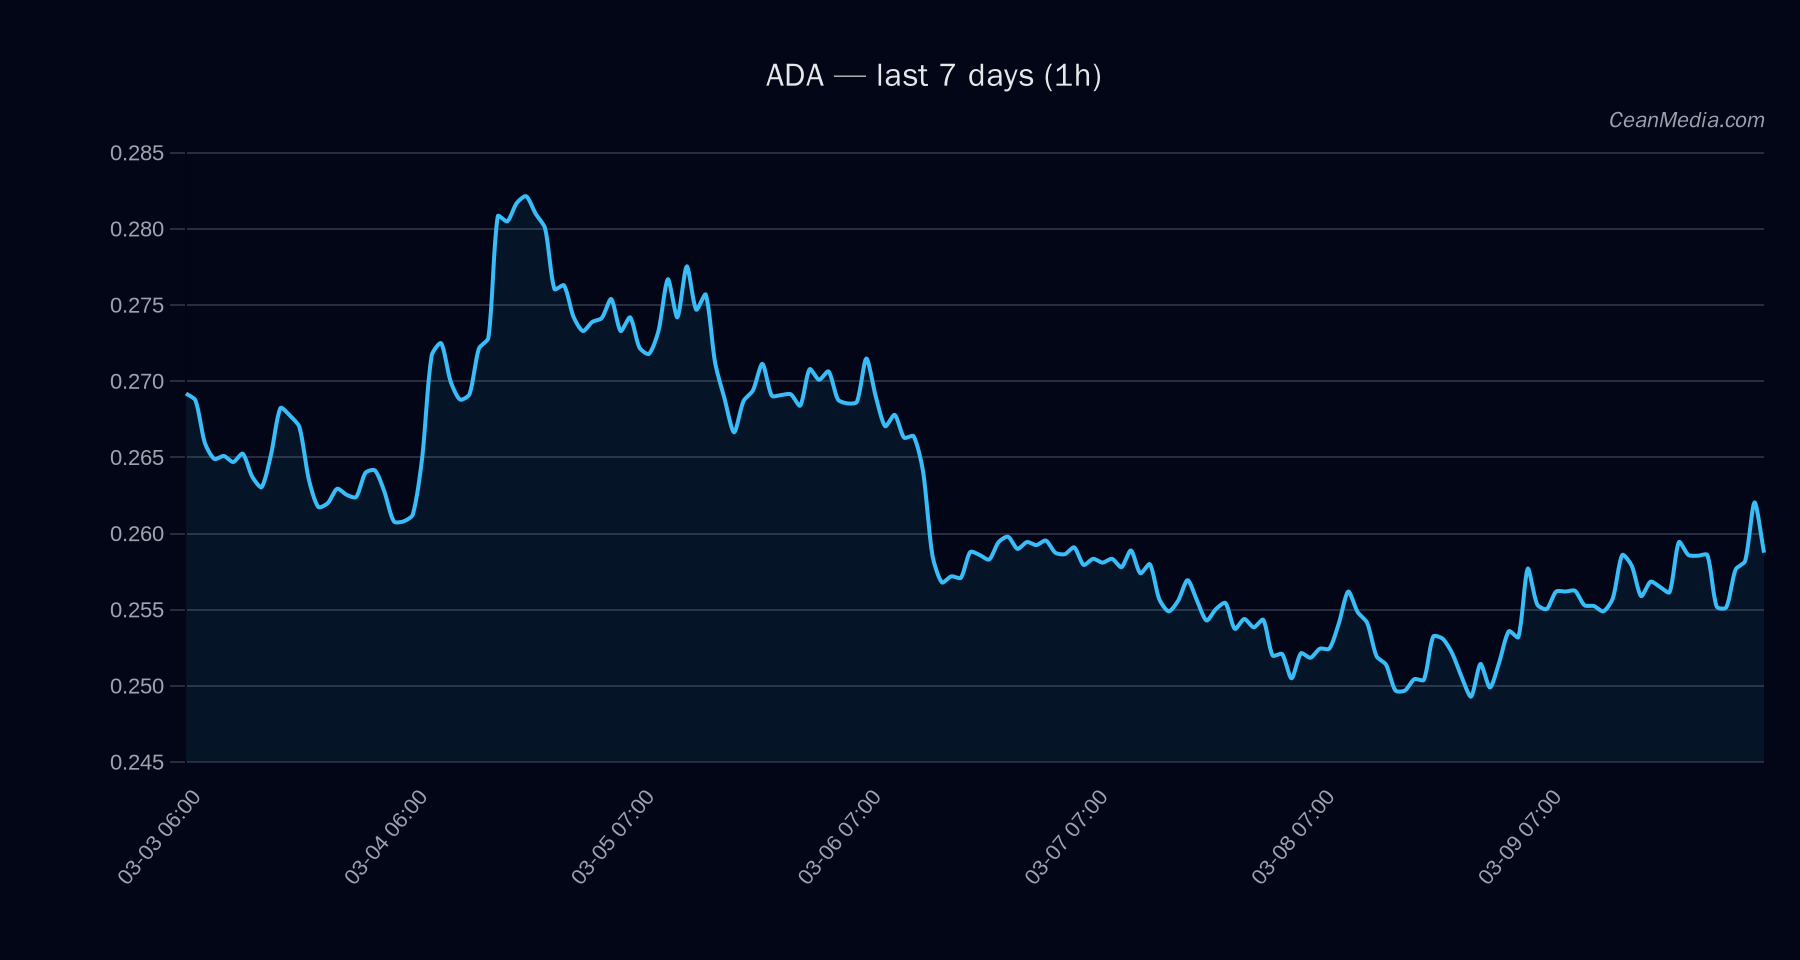
Technical Analysis: ADA
0.2612 down (61%) EMA12 > EMA26, SMA50 < SMA200, RSI 62 σ24h 0.74%, Vol regime: Very low 0.2488 – 0.2651 0.255 0.285 / 0.265 - Upside: > 0.265 → 0.2718 – 0.2771
- Downside: < 0.255 → 0.2509 – 0.2457
Drivers
- Return 24h: 0.02
- EMA slope: 0.0006
- Funding z-score: -0.48
- Basis z-score: 0.48
- Order-book imbalance (EMA5): 0.07
- BTC return 24h: 0.03
- BTC vol regime: 0
- BTC trend strength: 0.98
ETF Flows (BTC/ETH)
Contextual note: ETF flow data covers BTC and ETH only and should be interpreted as a market breadth and risk-on/off signal. It is not a direct signal for ADA price moves.
- BTC ETF: 1D +$57.8M | 5D -$372.2M | 10D +$422.1M
- ETH ETF: 1D +$0.3M | 5D -$116.0M | 10D +$36.7M
What to Watch Next
- Watch for a break above 0.265 to signal potential move toward 0.2718–0.2771.
- Break below 0.255 would open downside into 0.2509–0.2457 range.
- Maintain awareness of ETF flow shifts in BTC/ETH as contextual risk-on/off backdrop, not primary ADA signal.
- Monitor RSI around mid-60s for potential continuation or divergence with price action, given very low vol regime.
Hashtags: #ADA #Cardano #CryptoAnalysis #MarketUpdate #ETFFlows #BTC #ETH #RiskOn #TechnicalAnalysis #PriceAction #CryptoNews