Market Snapshot
Bitcoin (BTC) is trading around mid to upper-70k range with a short-term down bias in the current forecast. The broader context shows a very low volatility regime and a cautious sentiment environment, indicated by a Fear & Greed index in the Extreme Fear territory recently. Market breadth remains strong (>50h breadth at 100%), and spot risk indicators point toward a near-term consolidation within established support and resistance bands.
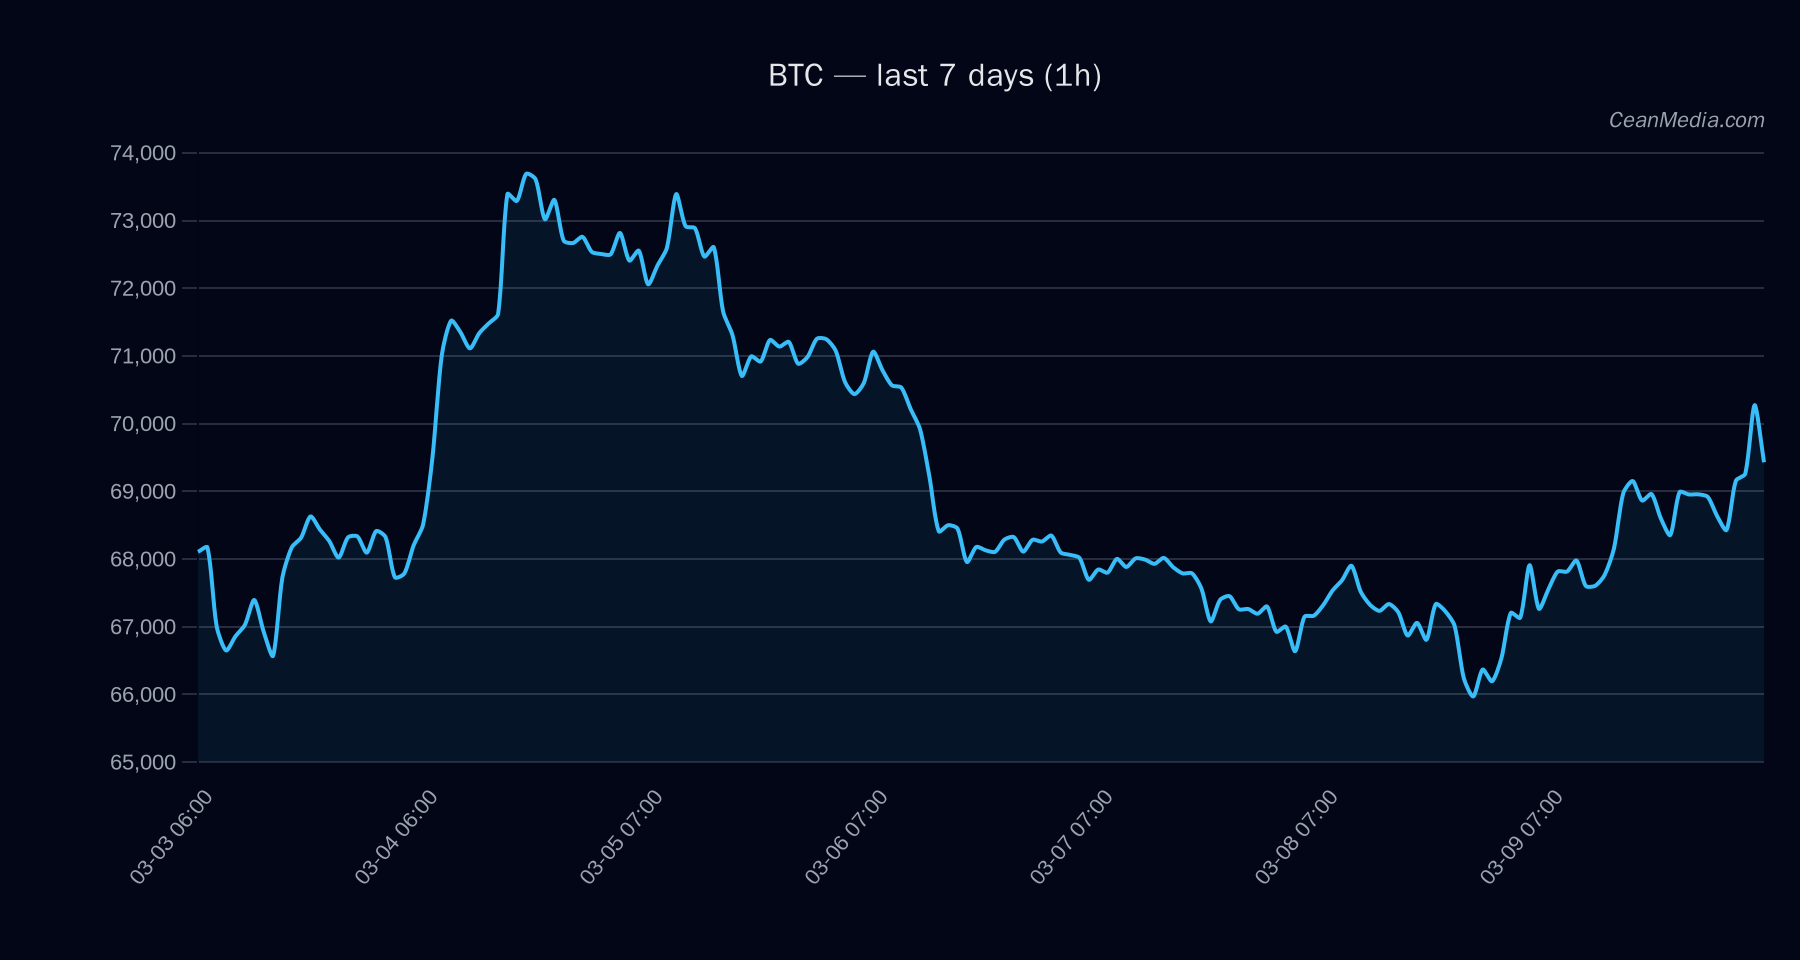
Technical Analysis: BTC
- Price: 69,843.77
- Short-Term Forecast: down (54%)
- Probabilities: Up 37% | Side 9% | Down 54%
- Key TA indicators: EMA12>EMA26, SMA50
- RSI: 64 (neutral)
- Band/Targets: P20–P80: 68,072.32 – 72,428.73; P50: 69,444.93
- Major Support: 64,875 | Near Support: 68,450
- Major Resistance: 70,975 | Near Resistance: 71,250
- Upside trigger: 1h close > 71,250 → 72,665.46 to 74,090.27
- Downside trigger: 1h close < 68,450 → 67,077.96 to 65,709.02
- Bias: Downward in the near term, with sideways tendencies given EMA relations and low volatility.
Drivers
- Return 24H: 0.06%
- EMA Slope: 0.0034
- Funding Z-Score: -1.29
- Basis Z-Score: 0.21
- Order-Book Imbalance (EMA5): 0.04
- BTC Return 24H: 0.06%
- BTC Vol Regime: Very low
- BTC Trend Strength: 1.77
ETF Flows (BTC/ETH)
Contextual market signals: ETF flow data is provided for BTC and ETH and should be interpreted as a contextual backdrop rather than a primary signal for BTC price action. The BTC ETF flow shows a net positive 1D movement and larger negative flow over 5D, with a substantial 10D net positive signal. ETH also shows minor positive 1D flow with larger negative 5D flow. These flows can reflect broader investor positioning, liquidity shifts, and hedging activity but are not a sole driver of BTC’s short-term trajectory.
- BTC ETF: +$57.8M (1D) | -$372.2M (5D) | +$422.1M (10D)
- ETH ETF: +$0.3M (1D) | -$116.0M (5D) | +$36.7M (10D)
What to Watch Next
- Watch for a close above 71,250 to confirm a short-term upside extension toward 72,665–74,090 if the breakout holds on higher timeframes.
- Alternatively, a breakdown below 68,450 would expose a lower range toward 67,078–65,709.
- Monitor changes in volatility regime and intraday volume, as a shift from very low to higher regimes could precede sharper moves.
- Keep an eye on ETF flow signals as contextual framing, not primary trading signals, especially if BTC/ETH ETF activity accelerates in the near term.
Hashtags: #BTC #Bitcoin #TechnicalAnalysis #ETFFlows #MarketPulse #CryptoNews #CryptoMarkets #TradingStrategy #PriceAction #Volatility #Liquidity #MarketSentiment