Market Snapshot
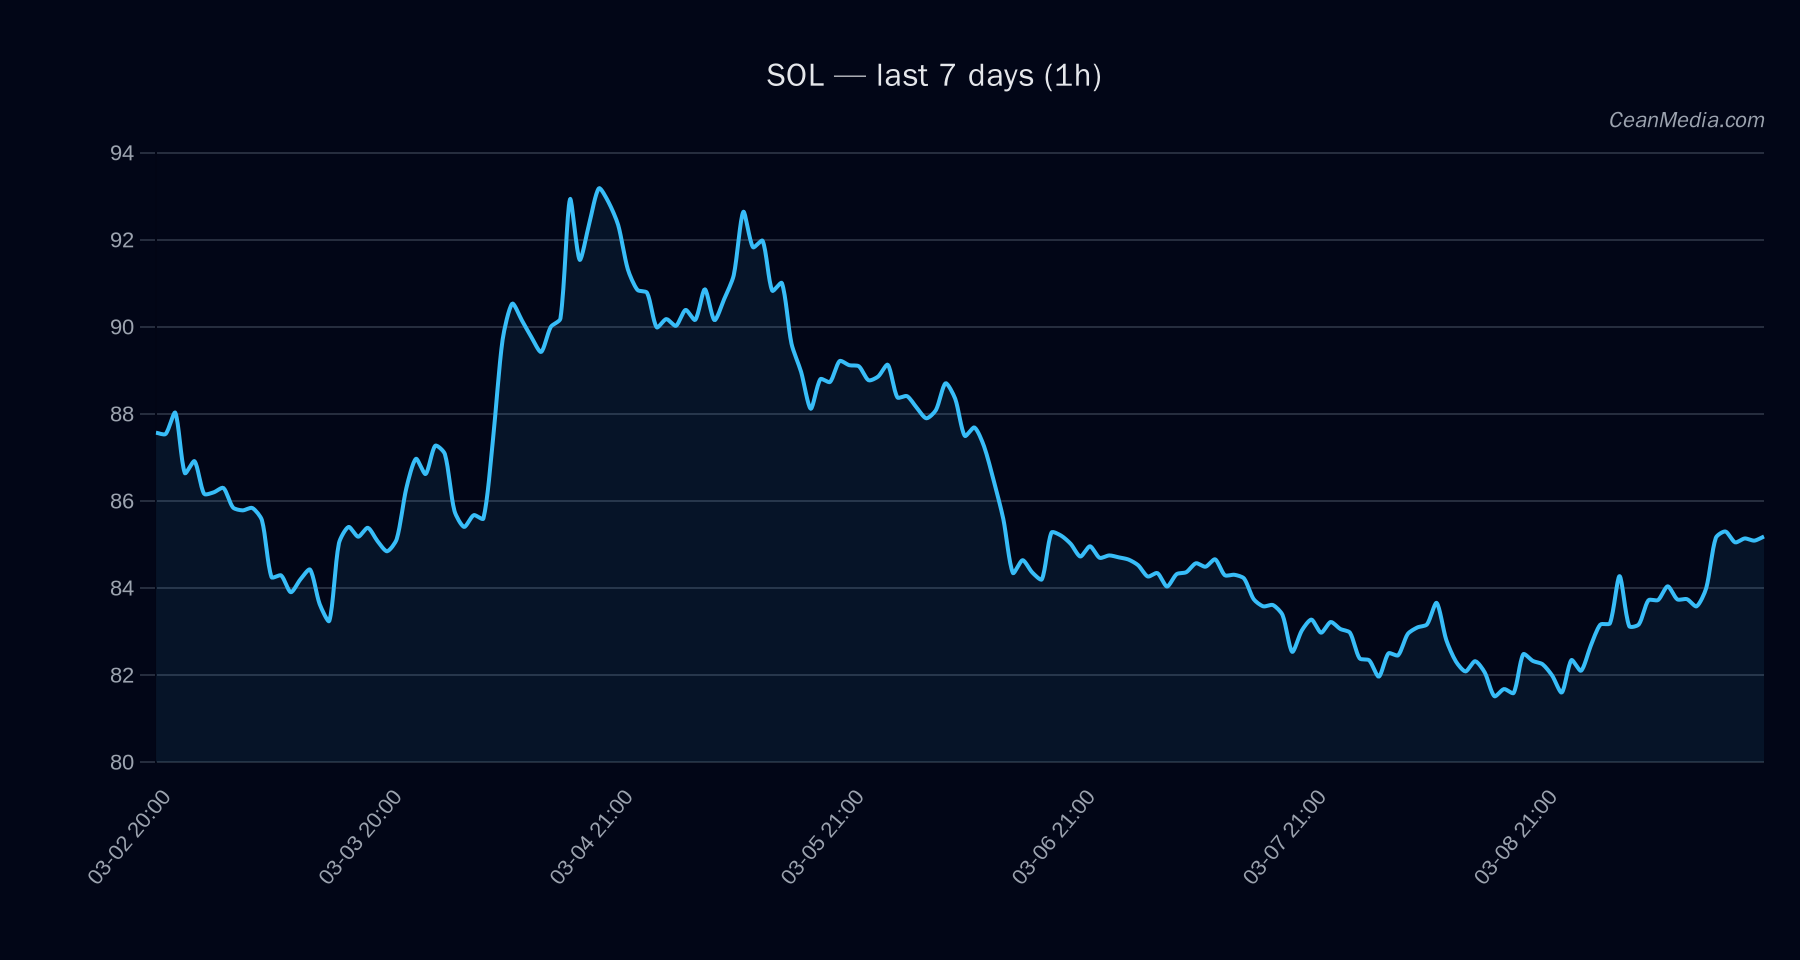
SOL is trading near key support and resistance boundaries, with the latest short-term forecast indicating a bias toward downside. The price sits between major support at 79 and near-term support at 84.2, and near-term resistance at 87.6 with a major resistance near 89. The current price in the primary TA snapshot is around 85.9.
Contextual signals note very low volume regime and neutral to slightly bearish tilt in the near term, with breadth indicators and BTC-related context suggesting cautious positioning.
Technical Analysis: SOL
- Current price (approx): 85.9
- Bias: Down (64%), with sideways TA components indicated by EMA12>EMA26, SMA50
- Key levels:
- Support — Major: 79
- Support — Near: 84.2
- Resistance — Near: 87.6
- Resistance — Major: 89
- Targets: If 1h close > 87.6, potential move toward 89.34 – 91.09. If 1h close < 84.2, potential move toward 82.47 – 80.79.
- Metrics to watch: EMA slope, RSI near mid- to high-range, volatility regime and order-book balance (EMA5) for intraday shifts.
- Invalidation/Trends: Breaks above 89 would suggest a stronger bullish setup; sustained closes below 79 could accelerate a deeper pullback toward lower supports.
- Key levels:
Drivers
- Return 24H: +0.04
- EMA slope: +0.0015
- Funding Z-score: +0.83
- Basis Z-score: +0.46
- Order-book imbalance (EMA5): +0.08
- BTC Return 24H: +0.02
- BTC Trend Strength: 0.75
- Vol Regime: Very low
Overall momentum indicators point to a cautious stance with a modest tilt to downside in the near term, reinforced by a low-volatility environment.
ETF Flows (BTC/ETH)
Contextual note: ETF data provided pertains only to BTC and ETH. This serves as macro-market context and is not a primary signal for SOL price action. BTC ETFs show net negative flows in the 1D and 5D windows, with a smaller positive or flat reading on the 10D line. ETH ETFs likewise show negative flows in the shorter windows. These flows can reflect risk-on/risk-off sentiment shifts but should not be over-interpreted as SOL catalysts.
- BTC ETF: 1D -$348.9M | 5D -$235.0M | 10D +$160.5M
- ETH ETF: 1D -$91.5M | 5D -$87.3M | 10D -$5.1M
What to Watch Next
- Monitor SOL price close relative to 84.2 and 87.6 to gauge near-term direction.
- Watch for a break above 89 or below 79 as potential confirmation of a new directional bias.
- Observe changes in BTC/ETH ETF flows for shifts in macro risk appetite, while noting these do not directly signal SOL moves.
- Maintain attention on volume regime and order-book dynamics (EMA5) for intraday momentum shifts.
Hashtags: #solanalysis #solusd #cryptotrading #marketforecast #etfflow #btcflows #ethflows #tradingsignal #riskmanagement #technicalanalysis #cryptoalerts #blockchain