Market Snapshot
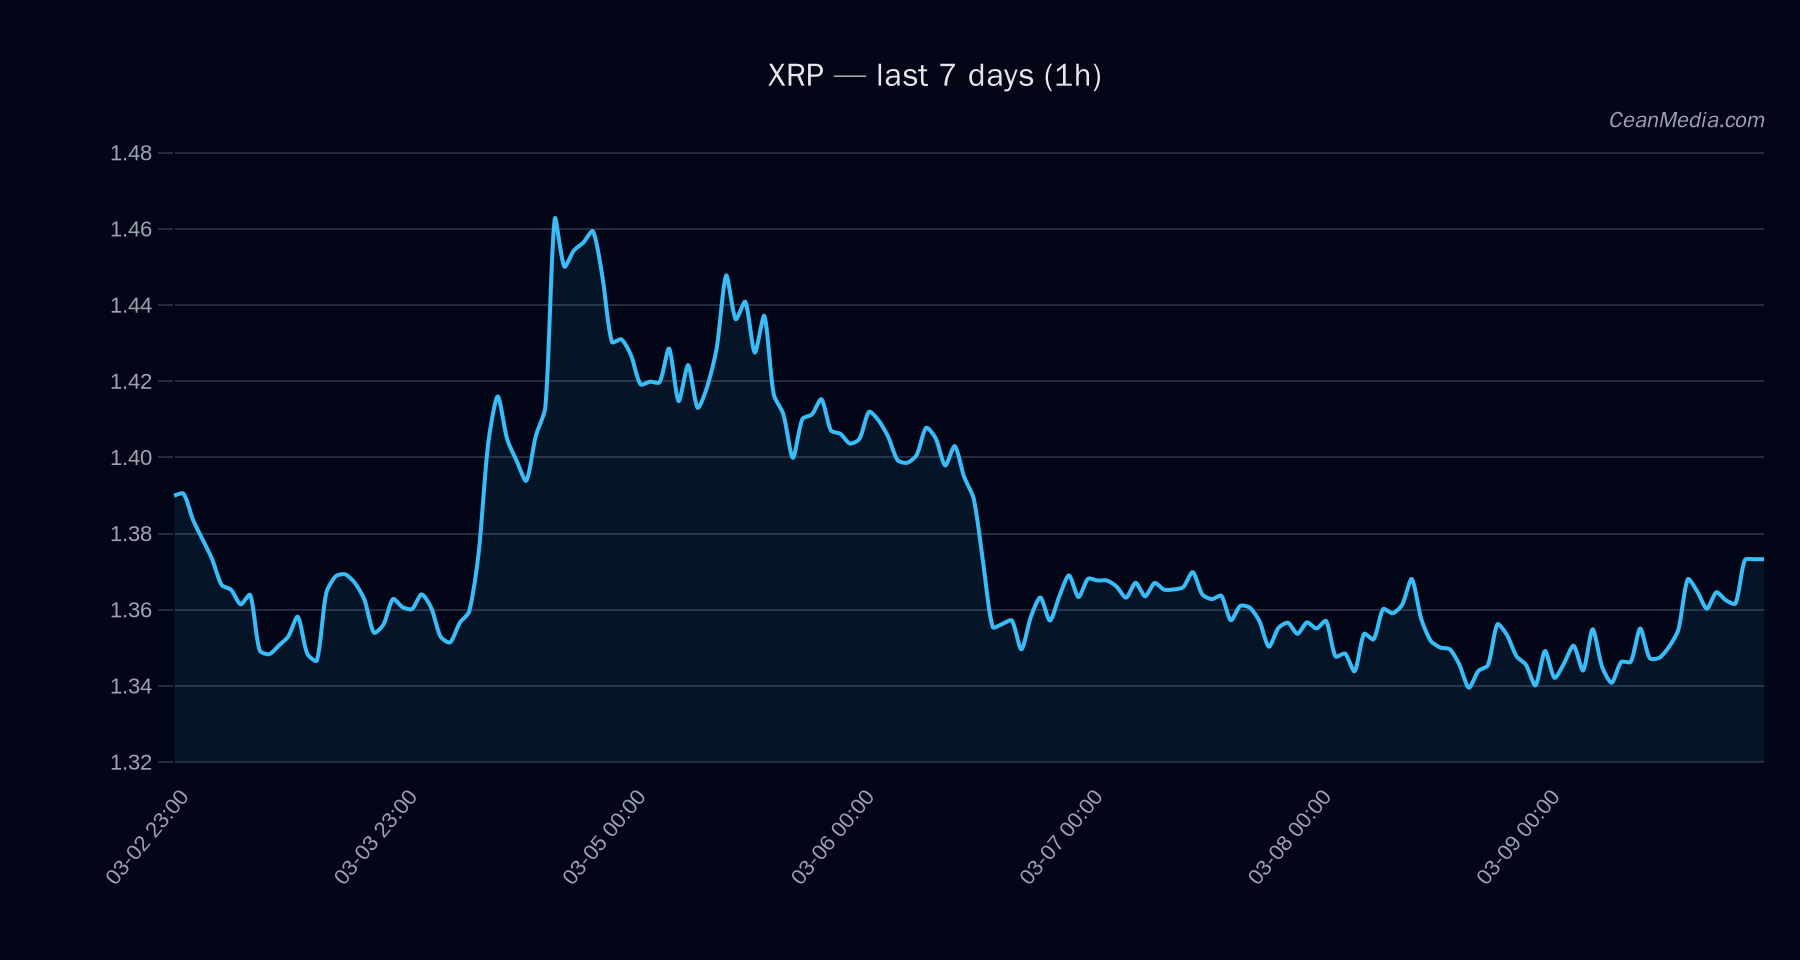
XRP traded near the 1.34–1.40 band with a current price around 1.37. The short-term forecast remains tilted to the downside with a probability of approximately 66% for a move lower, while upside probability sits around 27%. Key moving averages show mixed signals (EMA12 > EMA26; SMA50 < SMA200), and the RSI sits near neutral at 57. The current context features very low volatility and a crowded breadth backdrop, with broader market states including Extreme Fear markers in sentiment metrics.
Technical Analysis: XRP
1.3674 1.3651 – 1.4241 1.34 1.44 1h close > 1.40 → 1.4226 – 1.4505 1h close < 1.34 → 1.3133 – 1.2864 Very low modest daily return, positive EMA slope, BTC influence on micro-movements
Drivers
- Top drivers in the short term include: 24h return (0.01), EMA slope (0.0015), and funding z-score (0.4).
- Order-book imbalance (EMA5) at 0.09 and BTC-related measures (BTC 24h return ~0.03) indicate limited directional pressure but some correlation with BTC movement.
- Volatility regime is reported as very low, with overall breadth readings skewed toward risk-off conditions in the broader market.
ETF Flows (BTC/ETH)
The ETF flow data provided covers BTC and ETH only and is presented here as context for market conditions, not as a primary signal for XRP. As of the latest data, BTC ETFs show a net negative day-to-date flow of about $349 million, with 5-day and 10-day frames also negative or modestly positive in disparate indications. ETH ETFs show negative daily flow of about $91.5 million, with 5-day and 10-day frames similarly mixed but negative overall. This information suggests a bias toward risk-off considerations in USD-denominated exposure within BTC/ETH instruments, which can indirectly influence cross-asset sentiment and liquidity conditions for altcoins like XRP.
What to Watch Next
- Watch for a close above 1.40 on an intraday basis to validate the upside extension to the 1.4226–1.4505 band.
- If price breaks below 1.34 on a sustained basis, monitor the 1.3133–1.2864 range for potential renewed downside pressure.
- Maintain awareness of BTC/ETH ETF flow shifts as potential indirect catalysts for macro risk sentiment, even though XRP is not directly tied to ETF signals.
- Observe changes in volatility regime and breadth indicators, which can precede meaningful moves in XRP beyond the current narrow band.
Hashtags: XRP, technical-analysis, crypto-market, ETF-flows, BTC, ETH, altcoins, trading-strategy, risk-management, market-microstructure