Market Snapshot
Solana (SOL) traded around the mid-to-upper 70s on 2026-04-02, with a short-term forecast for an uptick based on the latest TA signals. The broader market context shows low volatility regime and a risk-off tone across crypto assets as indicated by F&G fear indices and altbreadth metrics. BTC/ETH ETF flows provide ancillary context but are not a primary signal for SOL price action.
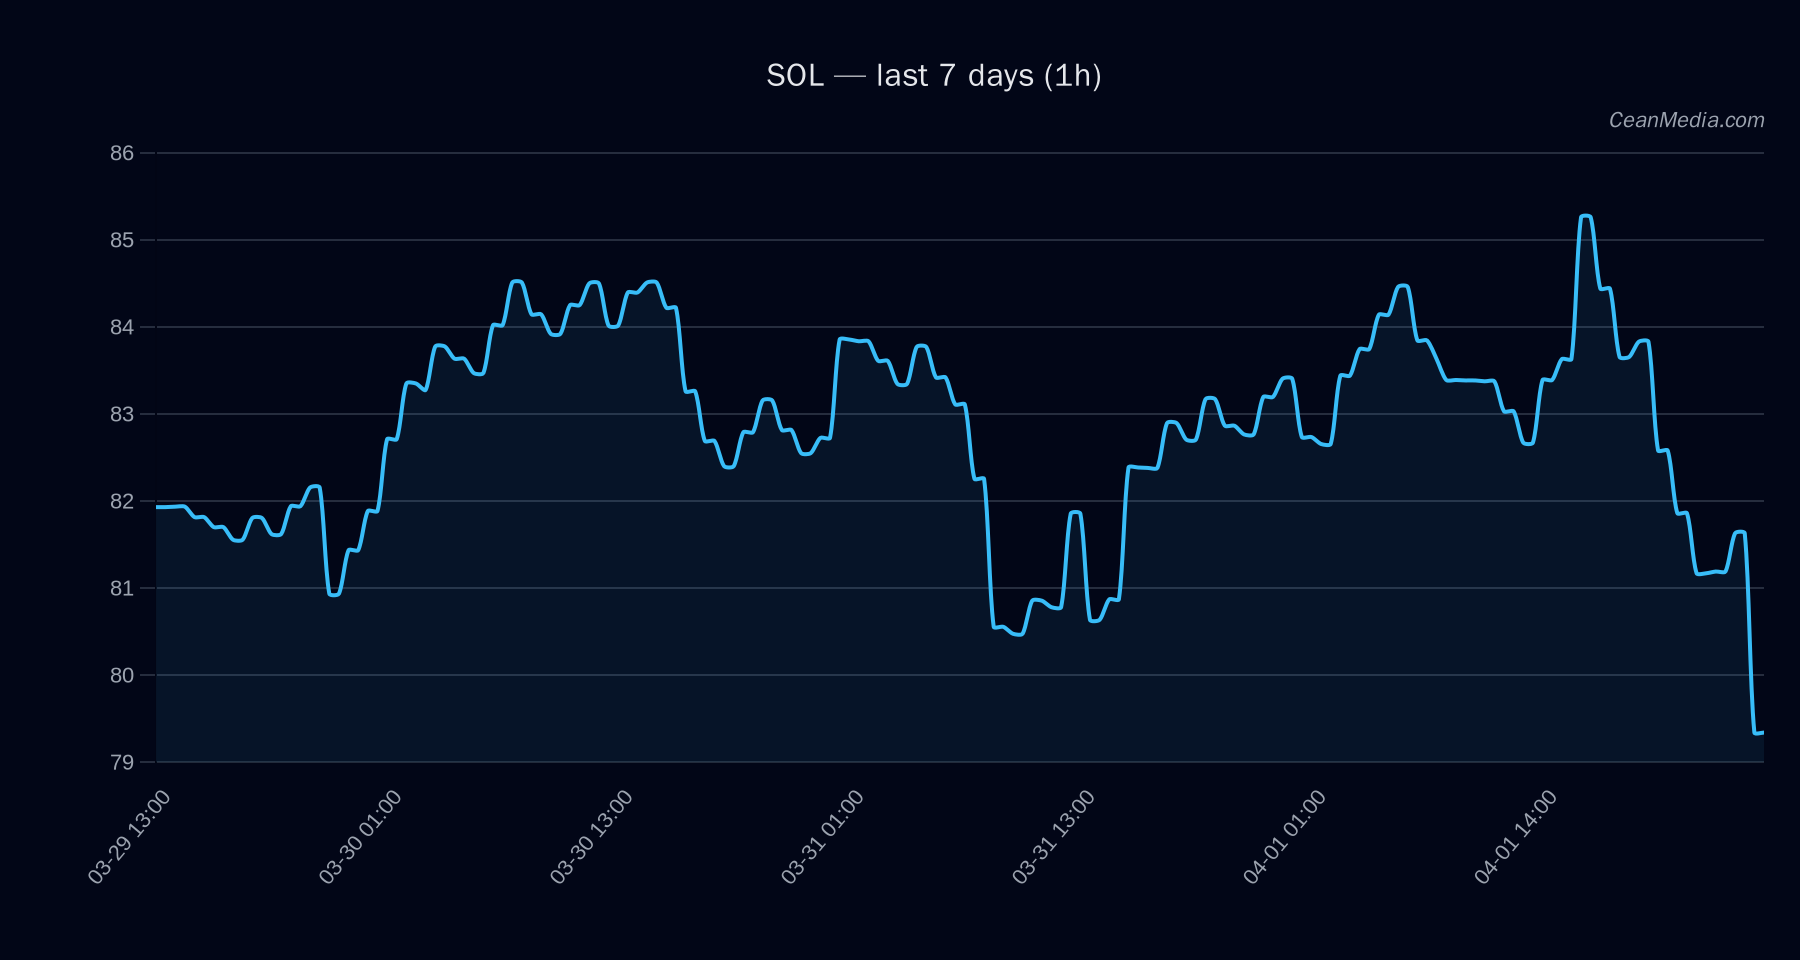
Technical Analysis: SOL
- Current price: 78.67
- Short-Term Forecast: Up (53%)
- Key indicators: EMA12 < EMA26, SMA50 < SMA200, RSI 28, volatility regime: Low, RSI oversold
- Support / Resistance: Major support 82.6, Near support 77.1; Major resistance 90.6, Near resistance 80.2
- Potential scenarios: Break above 80.2 targets 81.85–83.45; Break below 77.1 targets 75.55–74.01
- Band framework: P20–P80 range 73.12–85.92; P50 at 78.51
- Bias: Bullish if price closes above near resistance with sustained momentum; Bearish indicators present if RSI remains oversold and price tests support
- Invalidation levels: A close below near support 77.1 would suggest further downside toward 75.55–74.01
Drivers
- Top drivers: ETF-style liquidity indicators, depth and order-book signals, and z-score baselines influence short-term moves
- Notable contributions: LIQ IMB Z-SCORE and BASIS Z-SCORE show negative contributions; SPREAD BP and OBI EMA5 provide modest positive input
- Momentum/volatility snapshot: Vol regime: Low; vol-of-vol metrics remain subdued; trend strength around neutral to mildly positive
ETF Flows (BTC/ETH)
Context: ETF flow data is provided for BTC and ETH only, and should be interpreted as macro liquidity and risk sentiment signals rather than direct drivers for SOL moves. Positive BTC/ETH ETF inflows can indicate risk-on appetite, while outflows may reflect favorable liquidity conditions for risk assets. The data below is not a SOL signal but helps frame the broader market backdrop.
- BTC ETF: 1D +$117.5M; 5D -$97.0M; 10D -$419.9M
- ETH ETF: 1D +$30.0M; 5D -$28.3M; 10D -$146.6M
What to Watch Next
- Monitor price action around 80.2 to assess breach strength above near resistance
- Observe intraday momentum if SOL closes above 80.2 with volume support
- Watch for a test of 77.1 support; failure could shift bias toward 75.55–74.01
- Keep an eye on BTC/ETH ETF flow momentum as contextual risk sentiment signals
Hashtags: #Solana #SOL #CryptoAnalysis #MarketOutlook #ETFFlows #BTC #ETH #TechnicalAnalysis #TradingSignals #RiskManagement #MacroCrypto