
Market Snapshot
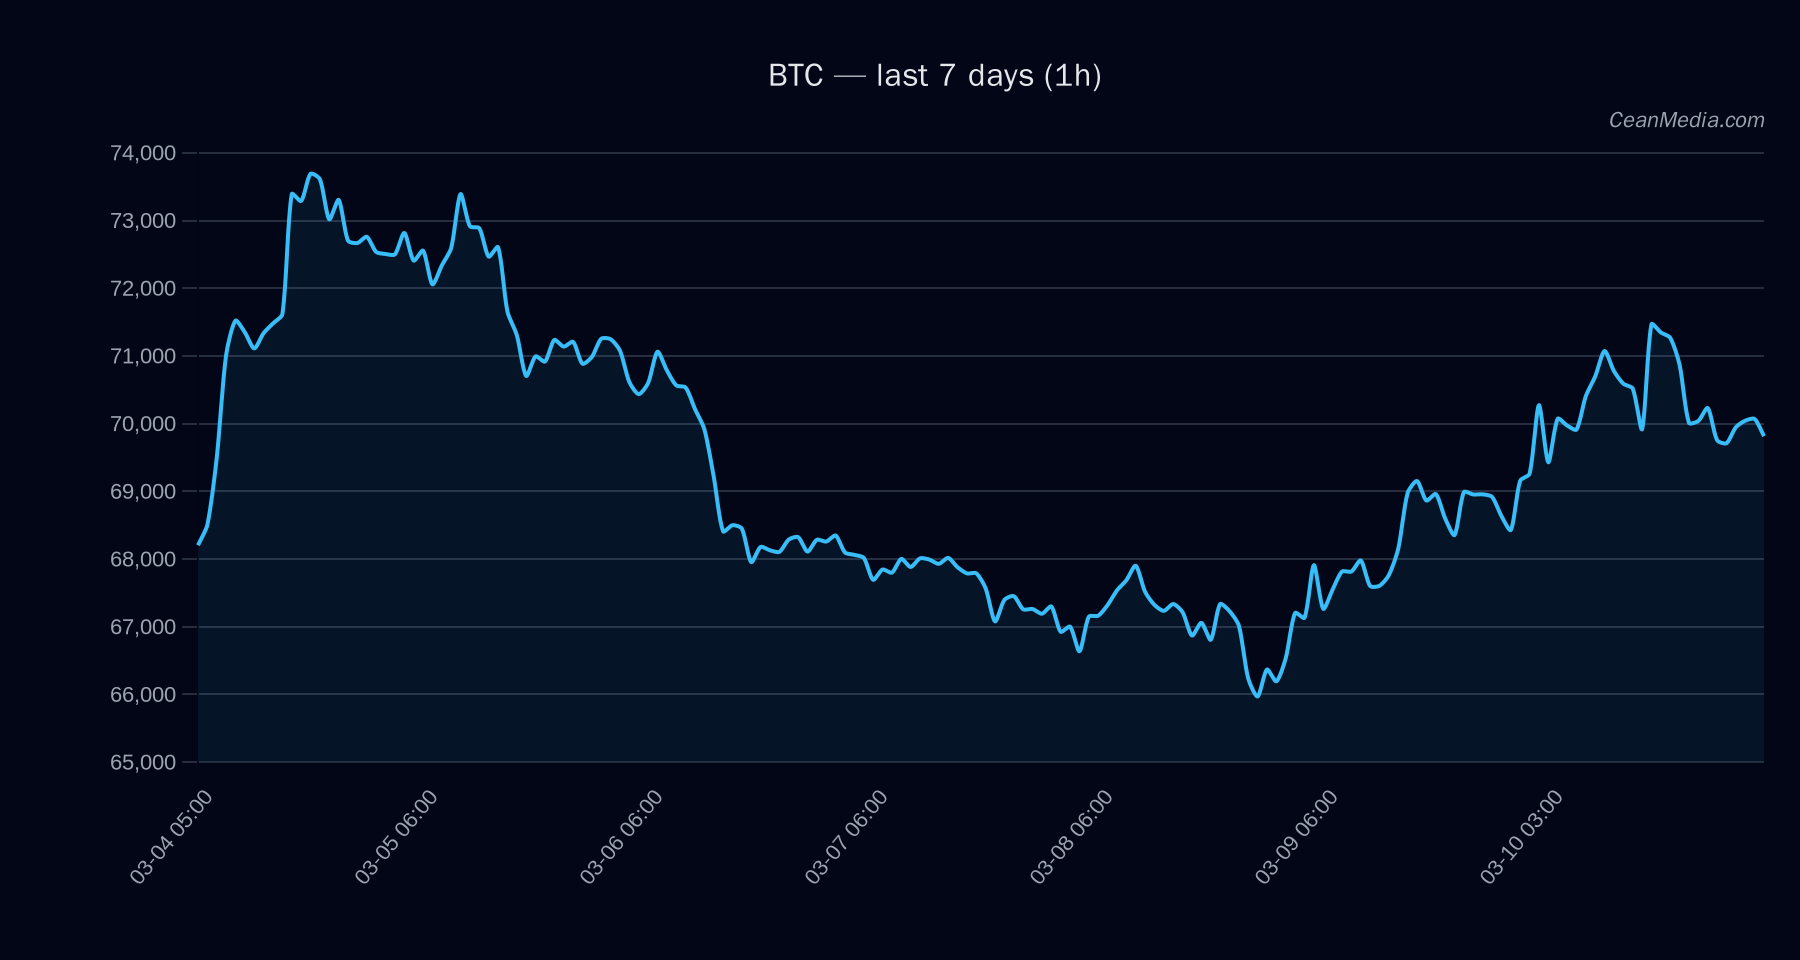
BTC is trading near the mid-to-upper portion of a defined range with near-term downside risk and a cautious bias. The current price is around 69,554, with a near-term support at 68,175 and resistance at 70,950. The market environment shows very low volatility and a subdued breadth signal, with overall momentum second-order in focus.
Technical Analysis: BTC
- Current levels: Support 68,175; Major resistance 71,075; Near-term resistance 70,950. P50 around 69,383; P20–P80 band ranges 67,621 – 72,075.
- Bias and triggers: Forecast leans to down with about 51% probability; a close > 70,950 on a 1h basis would imply potential upside targeting 72,364–73,783. A close < 68,175 would risk 66,800–65,437.
- Indicators: EMA12 > EMA26 and SMA50 > SMA200 suggest bullish structural alignment, RSI at 46 indicates neutral momentum, and the 24h volatility (σ24h) at 0.71% confirms a very low-vol regime. Overall trend strength is modest, with BTC trend signals showing low momentum.
Drivers
- Return over 24h: +0.01%
- EMA slope: slight negative signaling a marginal near-term tilt
- Funding z-score: -3.48 (negative, indicating potential bear tilt in funding dynamics)
- BASIS z-score: -1.53 (below-average basis)
- Order-book imbalance (EMA5): -0.24 (slightly negative; selling pressure modest)
- BTC 24h return and vol regime point to muted directional momentum
- Volatility regime: Very low, indicating a calmer market environment
- Trend strength: ~0.31 (neutral to modestly positive) across a longer horizon
ETF Flows (BTC/ETH)
ETF flow data is provided for BTC and ETH and is intended as contextual information rather than a primary signal for BTC pricing. The BTC ETF shows mixed signals over different horizons: +$57.8M in the 1D window, -$372.2M over 5D, and +$422.1M over 10D. ETH ETF data is smaller in magnitude and not necessarily correlated directly with BTC price moves. Interpret ETF flows as a sentiment context rather than a primary driver for BTC action.
- BTC ETF: 1D +$57.8M | 5D -$372.2M | 10D +$422.1M
- ETH ETF: 1D +$0.3M | 5D -$116.0M | 10D +$36.7M
What to Watch Next
- Monitor a close above 70,950 on a 1h basis for potential retargeting to 72,364–73,783.
- Watch for a break below 68,175 to assess downside risk towards 66,800–65,437.
- Keep an eye on the volatility regime and breadth signals for any abrupt shift in momentum.
- Consider ETF flow context as supplementary sentiment indicators rather than primary BTC signals.
Hashtags: #Bitcoin #BTC #MarketAnalysis #TechnicalAnalysis #ETFFloats #CryptoNews #CryptoMarkets #TradingStrategy