Market Snapshot
On 2026-03-10 SOL traded around $86.16 with a short-term bearish lean. The forecast indicates a 54% probability of downside in the near term, supported by a sideways-to-down bias in key moving averages and a neutral RSI around 48. Market breadth is positive in the broader context (Breadth>50h: 100%), but volatility is very low, suggesting a cautious environment with limited breakout potential.
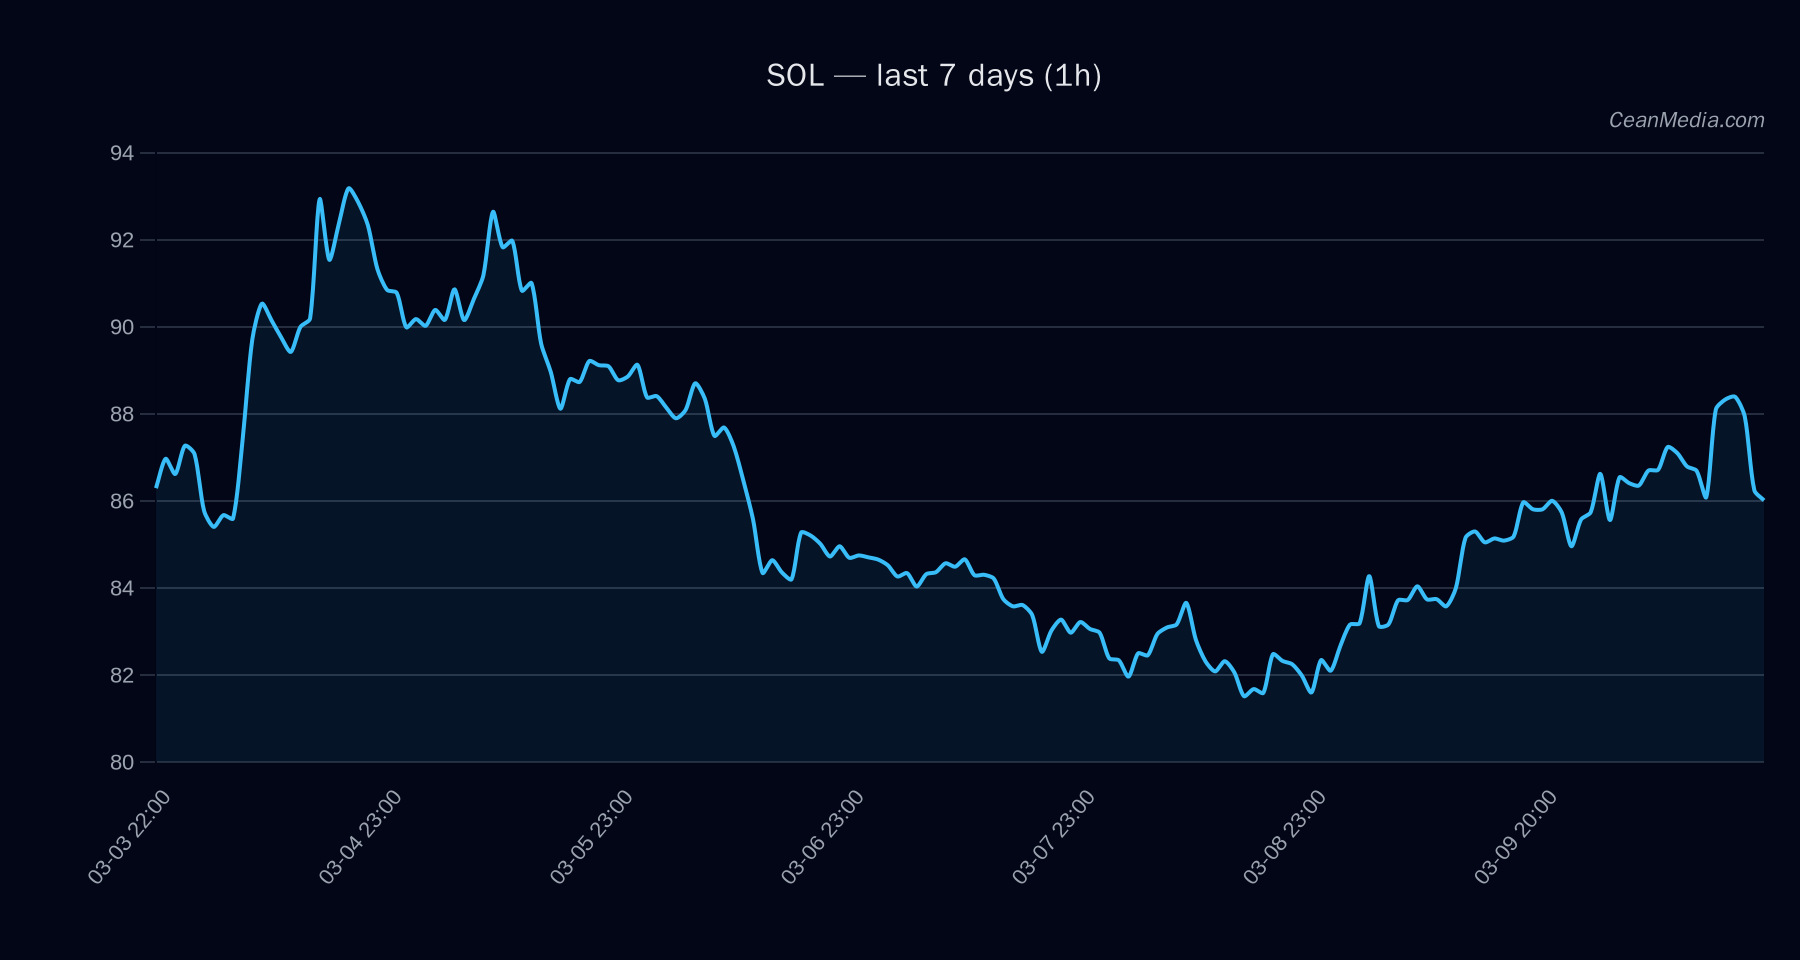
Technical Analysis: SOL
- Current price: 86.16
- Bias: Down (54%), with a sideways frame per TA indicators
- Key levels: Support major 79; Near-term support 84.4; Resistance major 89; Near-term resistance 87.9
- Breakout/invalidations: Break above 87.9 suggests a move toward 89.64–91.40; break below 84.4 implies 82.75–81.06
- Momentum indicators: EMA12>EMA26, SMA50
- Volatility and range: P50 at 85.62; P20–P80 range 83.73–88.81
- Signal summary: Forecast: Down; TA: Sideways with potential for limited downside until a decisive move beyond resistance or support is observed
Drivers
- Top signals: Return 24h ~0.01; EMA slope -0.0018; Funding z-score ~0.70; Basis z-score ~-0.56
- Order-book dynamics: EMA5 order-book imbalance ~-0.02
- BTC linkage: BTC 24h return ~0.02; BTC vol regime: 1; BTC trend strength ~0.61
- Additional context: Breadth over 50h is 100%; overall risk sentiment remains cautious with extreme fear readings noted historically; BTC dominance around 56.9% with a slight upward motion
ETF Flows (BTC/ETH)
ETF flow context provided is limited to BTC and ETH. BTC ETFs show a 1-day inflow of approximately $57.8M, with multi-day frames showing $-372.2M over 5 days and $+422.1M over 10 days. ETH ETFs show a small 1-day inflow (~$0.3M) and larger negative flows over 5 days (~$-116.0M) and positive over 10 days (~$+36.7M). It is important to note that ETF data is context for risk-on/off environment and is not a primary signal for SOL price; SOL-specific moves should be evaluated through its own TA and on-chain signals.
What to Watch Next
- Monitor for a close above 87.9 to target 89.64–91.40 if momentum confirms.
- Watch for a break below 84.4 to anticipate a move toward 82.75–81.06.
- Observe changes in BTC/ETH ETF flows as potential risk-on/off cues but treat as contextual rather than primary SOL signals.
- RSI stabilization around 50–55 with continued very low vol regime could extend sideways trading; await clear directional triggers.
Hashtags: #Solana #SOL #CryptoTrading #TechnicalAnalysis #ETFFlows #BTC #ETH #MarketSnapshot #PriceForecast #Momentum #RiskManagement