Market Snapshot
BTC currently trades near the key range defined by a major support at 65,425 and resistance at 71,900. The near-term forecast indicates a downside bias with a 53% probability, while the price remains within the mid-term structure defined by EMA12>EMA26 and SMA50>SMA200, RSI at 56, and very low 24h volatility. The current context features a breadth signal above 50h, neutral RSI, and a mixed fundamental backdrop reflected in derivative and funding signals.
Technical Analysis: BTC
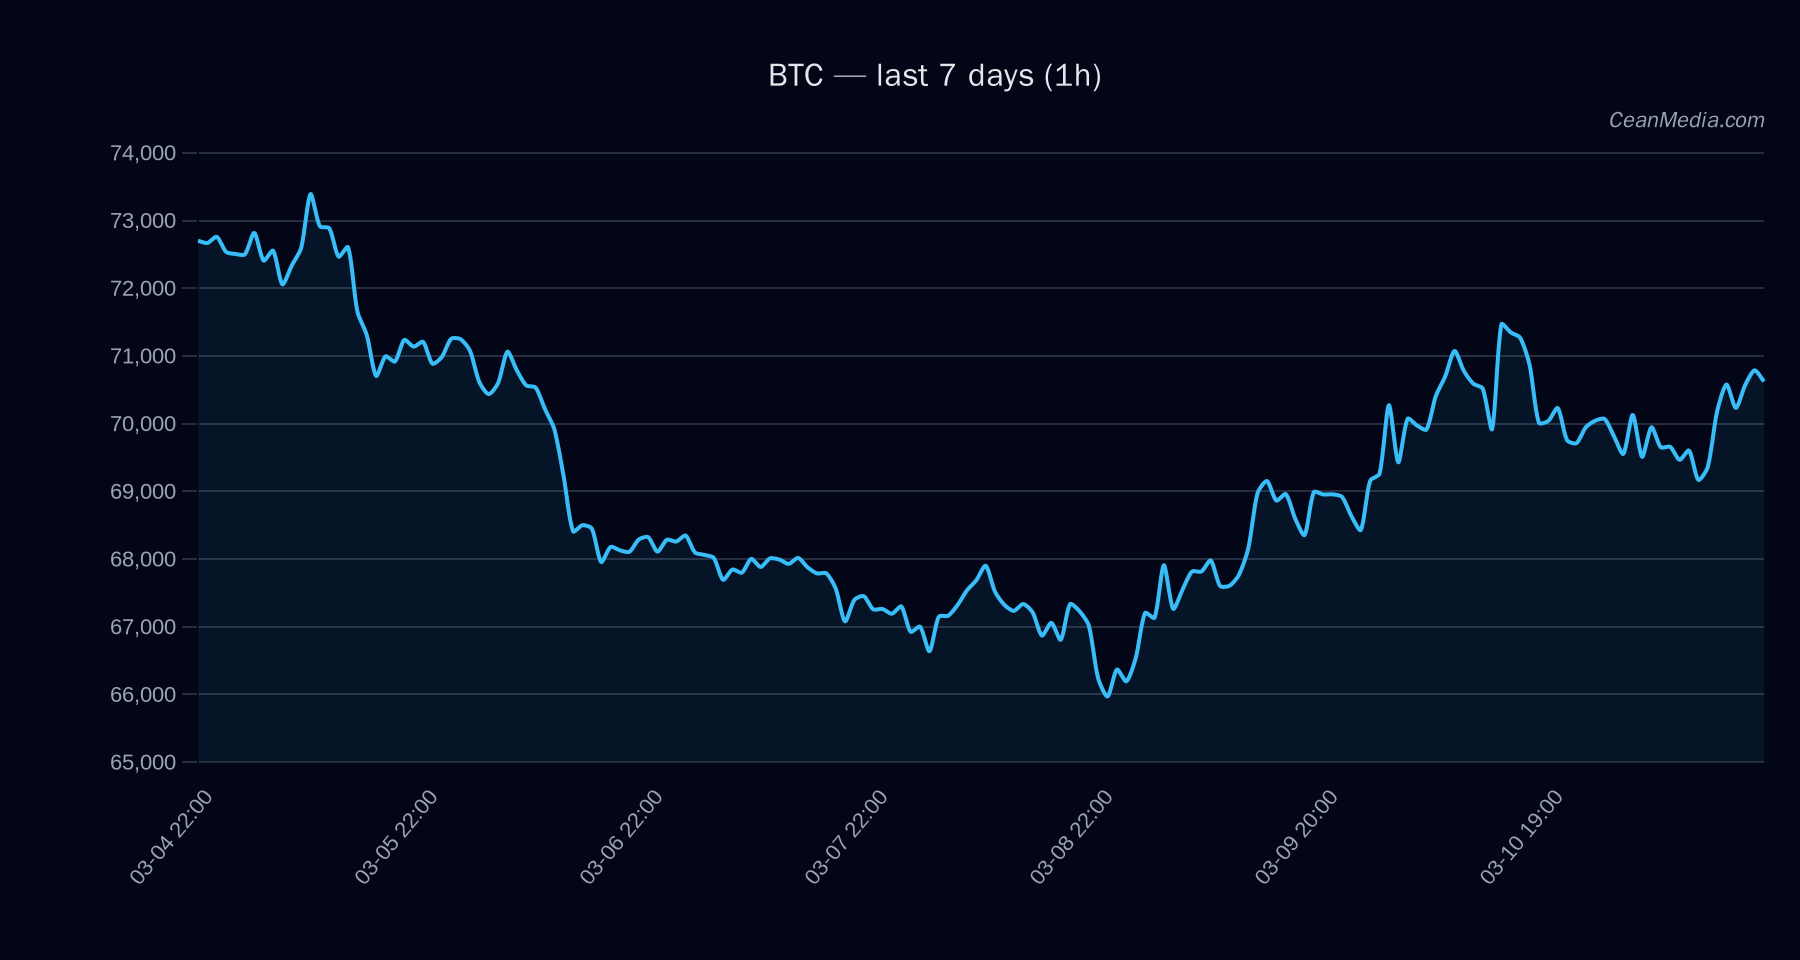
Price around 70,490.69. Major support 65,425; near-term support 69,075. Major resistance 71,075; near-term resistance 71,900. Upside target if 1h close > 71,900: 73,338.51 → 74,776.52. Downside target if 1h close < 69,075: 67,699.26 → 66,317.64. Forecast: down (53%). TA signals: bullish on trend indicators (EMA12>EMA26, SMA50>SMA200) with RSI at 56. Volatility regime: Very low. Distance from moving averages shows modest positive alignment, supporting a cautious bullish backdrop on trend measures, but price action remains biased lower in the short term. Band (P20–P80) 68,759.16 – 72,255.17; P50 69,793.94. Break above 71,900 implies potential move toward 73,338–74,777. Break below 69,075 implies potential move toward 67,699–66,318. invalidate bull case if price closes below 69,075 with sustained momentum; invalidate bear case if price closes above 71,900 with conviction.
Drivers
- Return 24h: negative (-0.11%).
- EMA slope: positive (+0.0017), indicating a mild upward tilt in the shorter moving average relative to the longer one.
- Funding z-score: negative (-1.56), suggesting a modestly bearish funding backdrop among perpetuals.
- Basis z-score: near neutral (0.01).
- Order-book imbalance (EMA5): positive (0.22), indicating modest buying pressure on short horizons.
- BTC return 24h and volatility regime align with a cautious stance; overall trend strength remains subdued (approx. 0.04–0.05 range).
ETF Flows (BTC/ETH)
ETF flow data are provided for BTC and ETH only and should be read as contextual signals rather than primary drivers for BTC price action. Recent data show BTC ETF flows of +$61.1M over 1D, with -$213.9M over 5D and +$304.4M over 10D. ETH ETF flows are +$12.6M (1D), -$51.4M (5D), +$36.3M (10D). These figures reflect market demand for regulated products and can influence liquidity and sentiment, but do not by themselves determine BTC price direction.
What to Watch Next
- Monitor price action around 69,075 and 71,900 for potential breakout or breakdown triggers.
- Watch for a daily close above 71,900 to validate upside targets toward 73,338–74,777.
- Key risk event: a sustained move below 69,075 could accelerate a test toward 67,699–66,318.
- Keep an eye on ETF flow momentum for BTC/ETH as a sentiment backdrop, while treating it as contextual information rather than a primary signal for BTC.
Hashtags: #BTC #Bitcoin #marketanalysis #ETFFlows #technicalanalysis #tradingstrategy #riskmanagement #macrocrypto #cryptoeducation
Hashtags line (for publication tagging):
Hashtags: #BTC #Bitcoin #MarketReview #TechnicalAnalysis #ETFFlows #CryptoTrading #CryptoMarkets #MarketSentiment #RiskManagement