Market Snapshot
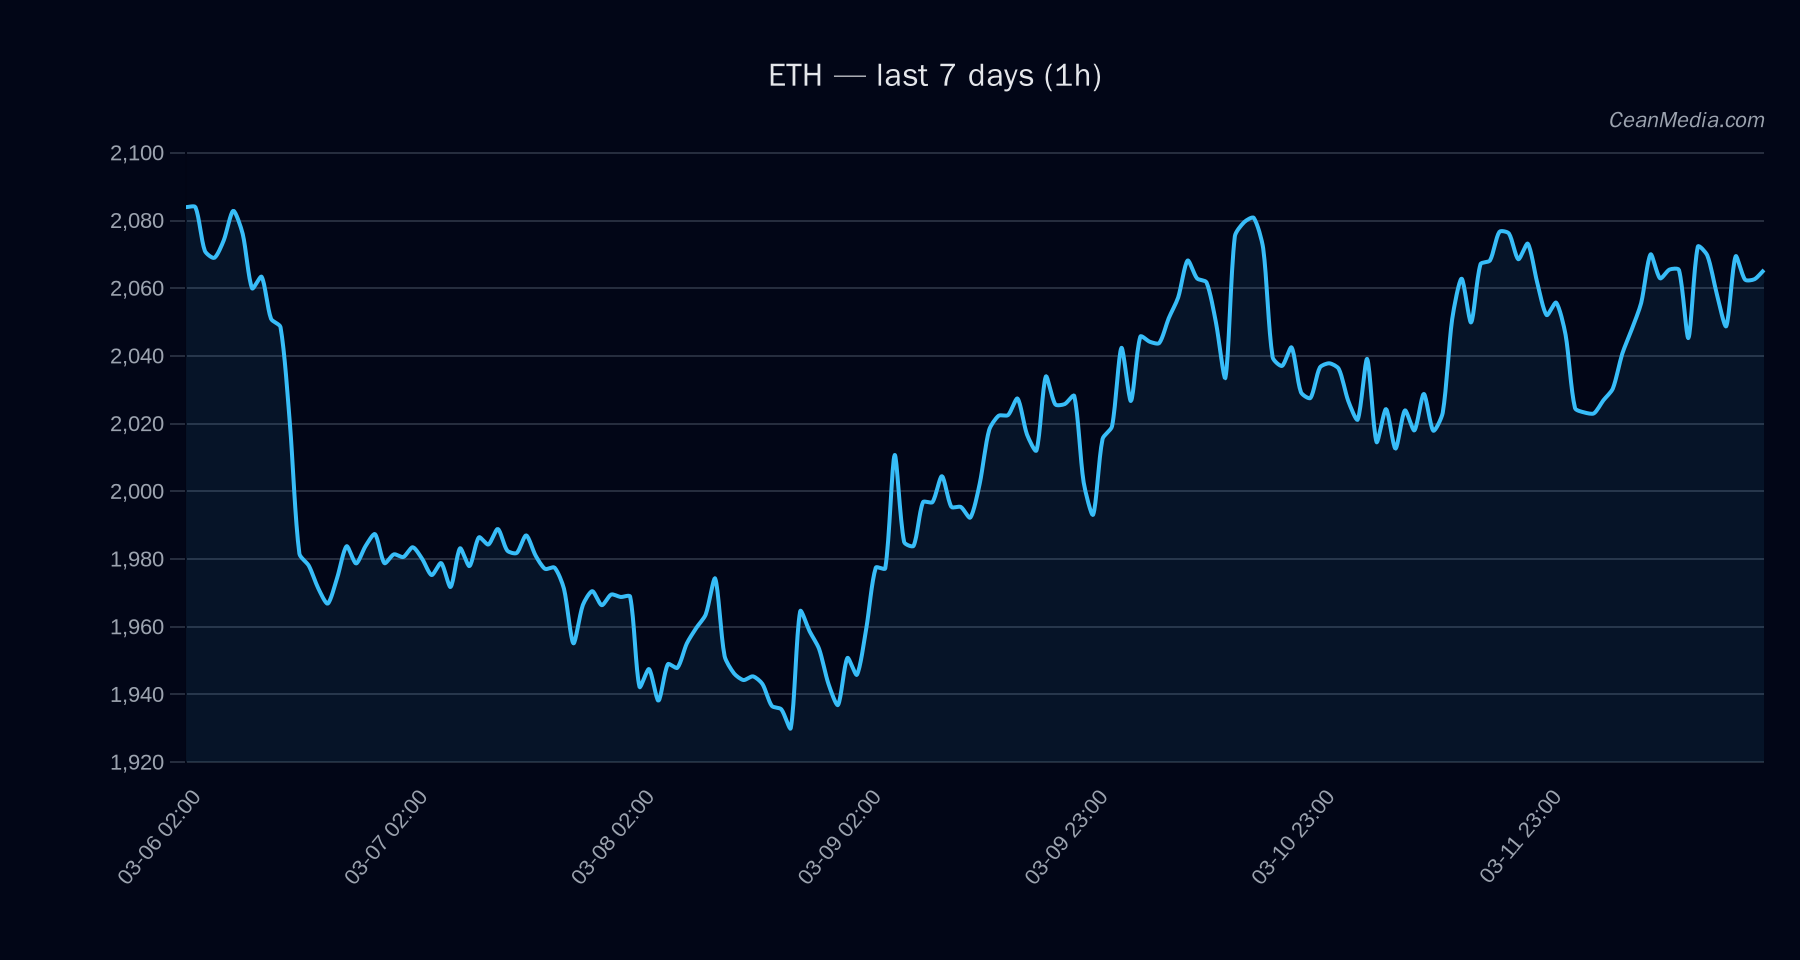
Ethereum (ETH) trading around the 2,080 area, with near-term support noted at 1,922 and resistance at 2,076, according to latest technical view. The forecast leans toward a bearish bias over the next 24 hours, but with a bullish undercurrent indicated by EMA crossovers and RSI in neutral territory. Market context includes very low volatility regimes and breadth readings showing broad participation above 50 hours, alongside BTC-dominance around mid-50s.
Technical Analysis: ETH
- Current price: 2,080.44
- Short-Term Forecast: down (49%)
- Probabilities (over 24h): Up 43%, Sideways 8%, Down 49%
- Key indicators: EMA12>EMA26, SMA50>SMA200, RSI 59
- Volatility regime: Very low (σ24h 0.57%)
- Daily bands: P20–P80 = 1,962.37 – 2,106.46
- Major support: 1,922
- Near support: 2,038
- Major resistance: 2,076
- Near resistance: 2,122
- Upside trigger: 1h close > 2,122 → 2,164.49 – 2,206.93
- Downside trigger: 1h close < 2,038 → 1,998.05 – 1,957.28
- Bias: Bullish within a range-bound framework; longer-term trend supported by EMA/SMA crossovers but near-term downside risk remains.
- Context: Breadth >50h shows broad participation; BTC-ETH correlation high (ρ 0.93 over 72h); vol regime is very low; Fear/Greed indicator extreme fear (F&G: 18).
Note: ETF data is provided for context and reflects BTC/ETH flows only. It should not be used as a primary signal for ETH trading decisions.
Drivers
- Return 24H: 0.18%
- EMA Slope: 0.0004
- Funding Z-Score: 0.05
- Basis Z-Score: 4.47
- Order-Book Imbalance (EMA5): -0.02
- BTC Return 24H: -0.28%
- BTC Vol Regime: 0
- BTC Trend Strength: 0.12
ETF Flows (BTC/ETH)
ETF flow data shown is limited to BTC and ETH and should be interpreted as context rather than a primary signal for ETH.BTC ETFs: +$246.9M 1D, +$490.2M 10D, -$28.1M 5D. ETH ETFs: +$12.6M 1D, -$51.4M 5D, +$36.3M 10D. Net positioning suggests ongoing interest in BTC exposure with modest ETH inflows in the short term, but overall interpretation should consider market structure, macro factors, and non-ETF liquidity drivers.
What to Watch Next
- Reaction to key level breaches: watch for a close above 2,122 to confirm a bullish extension toward 2,164–2,206.
- If price breaks below 2,038, monitor for support tests near 1,998–1,957 and potential momentum shift.
- Maintain awareness of the very low volatility regime, which can amplify sharp moves on modest shifts in liquidity or sentiment.
- Track BTC-related flows and macro risk sentiment, as BTC/ETH correlation remains high in current conditions.
Hashtags: #ETH #Ethereum #CryptoMarkets #TechnicalAnalysis #ETFFlows #BTC #MarketSnapshot #TradingStrategy #PriceAction #EMA #RSI