Market Snapshot
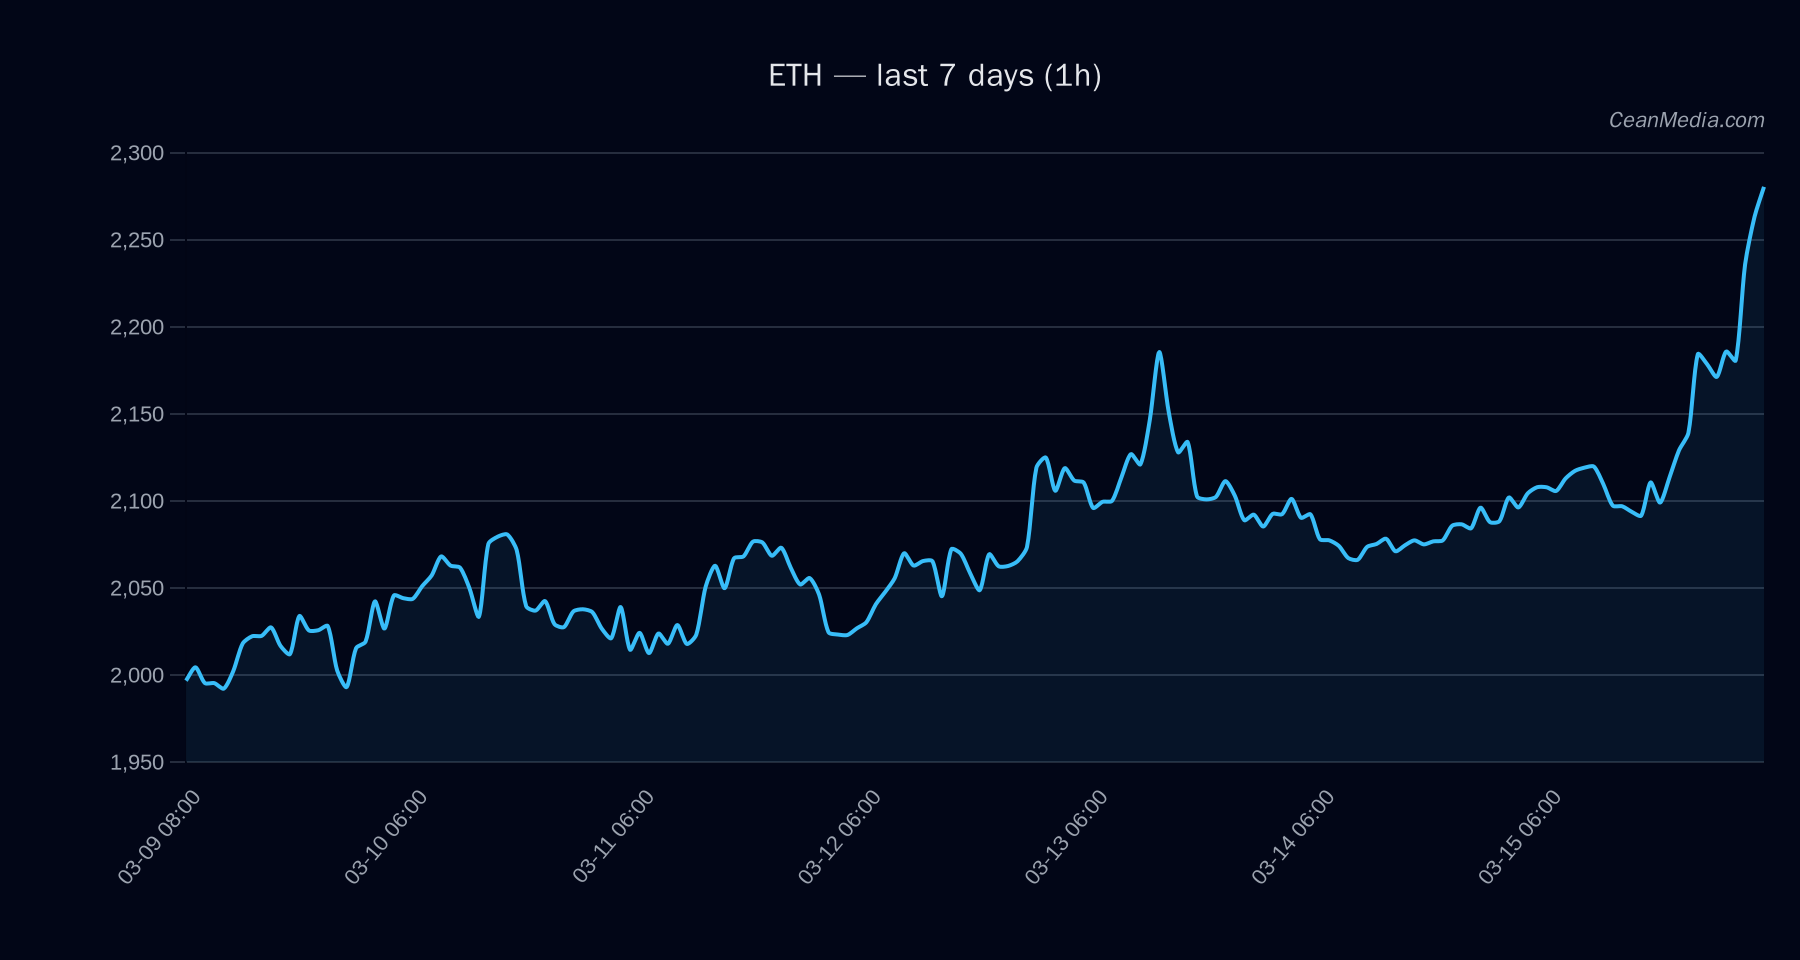
ETH trades around the 2,268–2,314 range in the near term, with a highlighted near-term support at 2,224 and resistance at 2,314. The immediate price trajectory hinges on a breakout above 2,314 (potential move toward 2,360.46–2,406.74) or a breakdown below 2,224 (potential move toward 2,134.49). Market breadth is strong (Breadth>50h: 100%), and BTC’s 24h performance shows a modest gain, providing a supportive backdrop for risk assets in a low volatility regime. Current RSI is in overbought territory (83), which may precede a consolidation or pullback absent a fresh catalyst.
Technical Analysis: ETH
2,012 - Near Support: 2,224
- Resistance (Major): 2,118
- Near Resistance: 2,314
- Projected Upside Trigger: 1h close > 2,314 → 2,360.46–2,406.74
- Projected Downside Trigger: 1h close < 2,224 → 2,178.96–2,134.49
- Band/Volatility: P20–P80: 2,169.82 – 2,329.12; σ24h: 0.76%; Vol regime: Very low
- Momentum Indicators: RSI 83 (overbought); EMA12 > EMA26; SMA50 > SMA200
- Probability Mix (next 24h): Up 46%, Sideways 4.6%, Down 49% (net bias slightly bearish within a mixed setup)
Drivers
24h return 0.08%; EMA slope 0.0071; Funding z-score 1.45; Basis z-score 1.32 OB/OS readings show overbought conditions; Bitcoin 24h return 0.04% with BTC volatility regime at 0 EMA5 imbalance −0.203 Vol regime: Very low; vol-of-vol: 0.0083 F&G (Fear & Greed) at 23 (Extreme Fear); BTC.D ~56.9%
ETF Flows (BTC/ETH)
Contextual information from ETF flows is provided for BTC/ETH and should be treated as supplementary rather than a primary signal for ETH. The BTC ETF has shown meaningful inflows (1D: +$180.4M; 5D: +$143.9M; 10D: +$230.3M), while ETH ETF flows are mixed (1D: +$34.3M; 5D: +$13.3M; 10D: −$24.2M). This data suggests a general risk-on appetite affecting large-cap crypto assets, with BTC receiving the stronger near-term inflows. ETH-specific ETF data is not a primary signal for ETH pricing but contributes to the broader liquidity and sentiment backdrop.
What to Watch Next
- Breakabove 2,314 would open a potential advance toward 2,360.46–2,406.74 in the short term.
- Breakbelow 2,224 would shift focus to 2,178.96–2,134.49, increasing downside risk.
- Monitor RSI for potential cooling if price advances further; consider watching for a consolidation within the P20–P80 band (2,169.82–2,329.12).
- Keep an eye on BTC ETF flows as a contextual risk-on/off signal, recognizing that BTC liquidity tends to influence ETH sentiment in cross-asset markets.
Hashtags: #ETH #CryptoMarkets #TechnicalAnalysis #ETFFlows #BTC #MarketSnapshot #Momentum #RSI #Liquidity #PriceAction #RiskOn #TradingStrategy