Market Snapshot
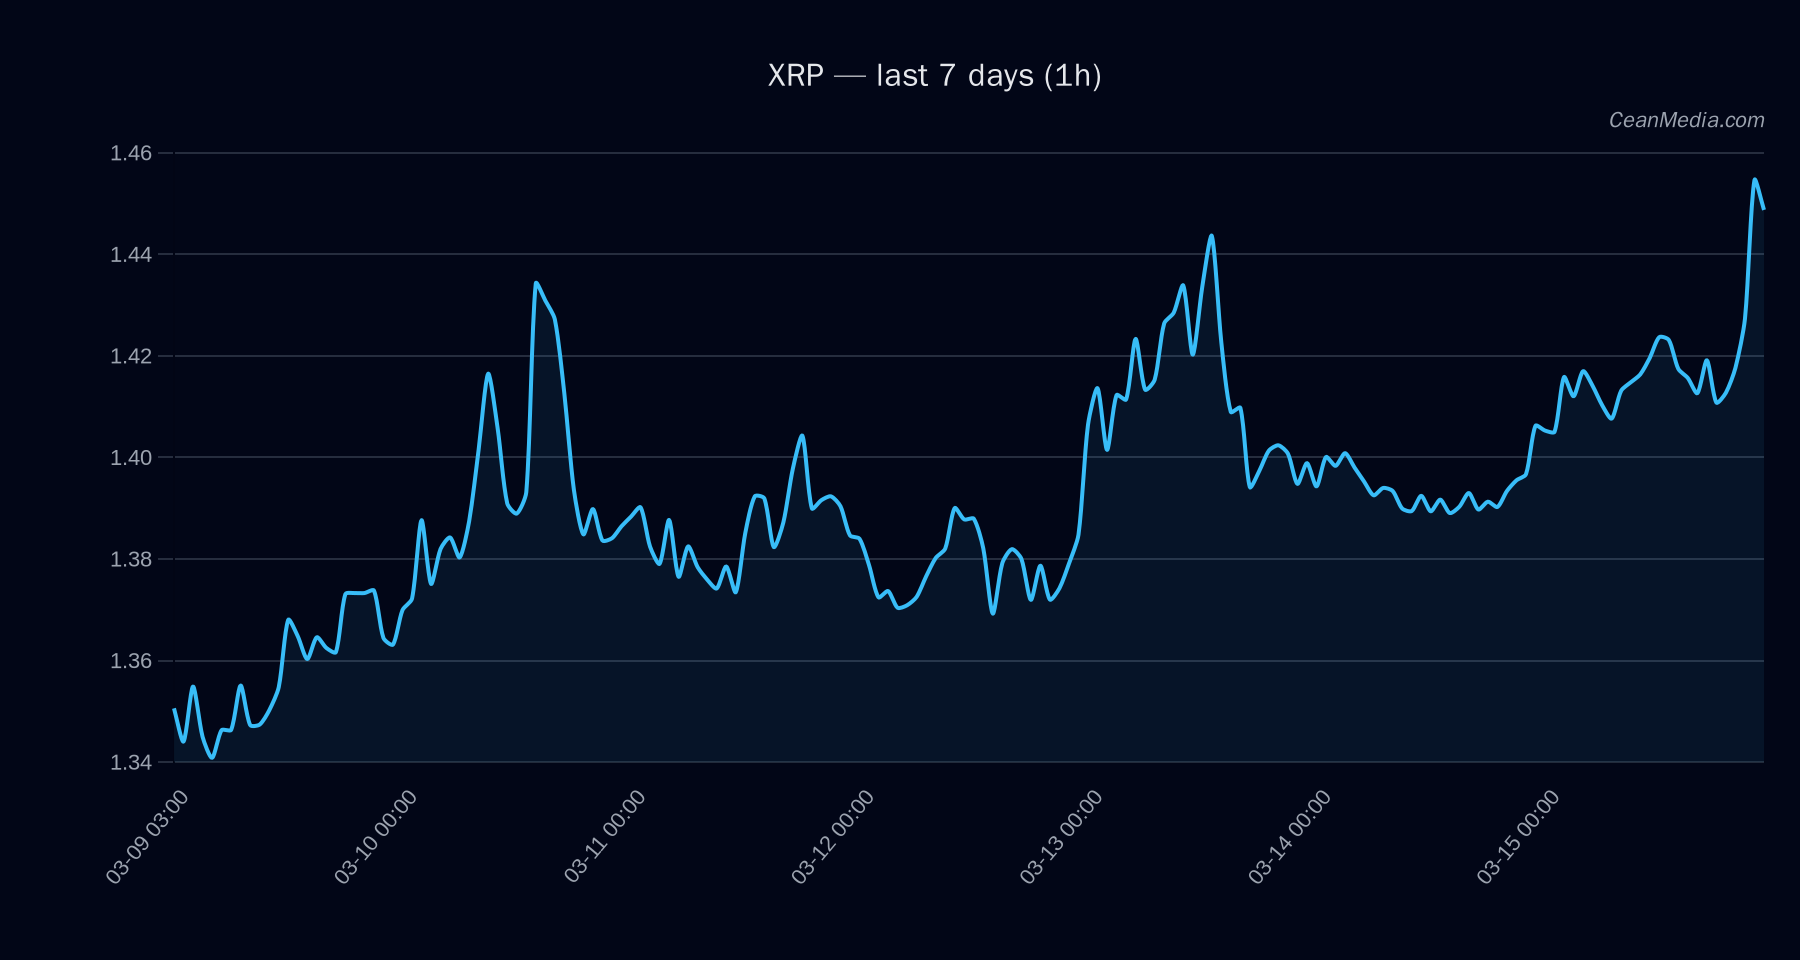
On 2026-03-16, XRP is trading around 1.44 with a short-term bias toward the downside. The immediate price framework sits between a near-term support at 1.42 and a near-term resistance at 1.48. Major support sits at 1.34, while major resistance is at 1.42. Momentum indicators show RSI around 67, with EMA12 above EMA26 and SMA50 above SMA200, signaling constructive longer-term structure despite the downside expected in the near term. The 24-hour volatility is reported as very low, with a low breadth environment (Breadth>50h at 100%).
Technical Analysis: XRP
Price (as of snapshot): 1.4448
- Forecast bias: Down (52%)
- Probabilities: Up 41%, Sideways 8%, Down 52%
- Indicators: EMA12 > EMA26, SMA50 > SMA200, RSI 67, σ24h 0.52%, Vol regime: Very low
- Band: P20–P80 = 1.415 – 1.4832
Key levels:
- Near-term support: 1.42
- Major support: 1.34
- Near-term resistance: 1.48
- Major resistance: 1.42
Expected moves:
- Upside trigger: 1h close > 1.48 → 1.5032–1.5326
- Downside trigger: 1h close < 1.42 → 1.3876–1.3593
Bias and rationale: The position remains within a defined range with a bearish short-term tilt given the current forecast, despite a bullish underlying structure indicated by the EMA/SMA relationship and a relatively high RSI. The very low volatility regime supports range-bound dynamics near the jam line between 1.42 and 1.48.
Invalidation considerations: Break above 1.48 would shift the short-term bias toward a potential testing of 1.50–1.53; a breakdown below 1.42 would tilt scope toward 1.39–1.36. Any sustained move beyond these bounds would warrant re-evaluation of the near-term forecast.
Drivers
- Return 24H: +0.03%
- EMA slope: +0.0028
- Funding Z-score: 1.43
- Basis Z-score: 2.25
- Order-book imbalance (EMA5): 0.04
- BTC 24H return: +0.02%
- BTC volatility regime: -1
- BTC trend strength: 1.37
The combination of EMA slope and z-score drivers suggests underlying momentum is modestly supportive for XRP on a longer horizon, even as the immediate stance remains cautious due to price positioning within the 1.42–1.48 range. The very low volatility regime reinforces a fragile near-term setup with limited directional breakout pressure.
ETF Flows (BTC/ETH)
Contextual ETF flows are provided for BTC and ETH and are not XRP signals. The data indicate notable ETF inflows in BTC and comparatively smaller inflows in ETH over multiple horizons, which can reflect broader risk-on appetite and macro liquidity conditions that may influence cross-asset correlations. This information should be considered as context rather than a primary driver for XRP pricing.
- BTC ETF: 1D +$180.4M | 5D +$143.9M | 10D +$230.3M
- ETH ETF: 1D +$34.3M | 5D +$13.3M | 10D -$24.2M
Interpretation: The BTC ETF inflows suggest a tilt toward risk-on liquidity in the near term, which can support higher-beta assets in broad market flux. ETH flows show smaller but positive exposure, aligning with a cautious risk-on backdrop. XRP-specific action should be interpreted with respect to its own technicals and fundamentals, with ETF data treated as contextual cross-asset signals rather than a direct XRP trigger.
What to Watch Next
- Watch for a close above 1.48 to confirm upside extension toward 1.50–1.53.
- Failure to hold 1.42 suggests a test of 1.39–1.36; monitor for momentum deterioration.
- Monitor BTC ETF flow momentum as an external risk-on/off indicator influencing market sentiment broadly.
- Observe any shifts in volatility regime; a move away from the very low regime could precede a directional breakout.
Hashtags: #XRP #CryptoMarket #TechnicalAnalysis #ETFFlows #Bitcoin #Ethereum #RiskOn #Liquidity #PriceAction #MarketStructure #Momentum #Altcoins