Market Snapshot
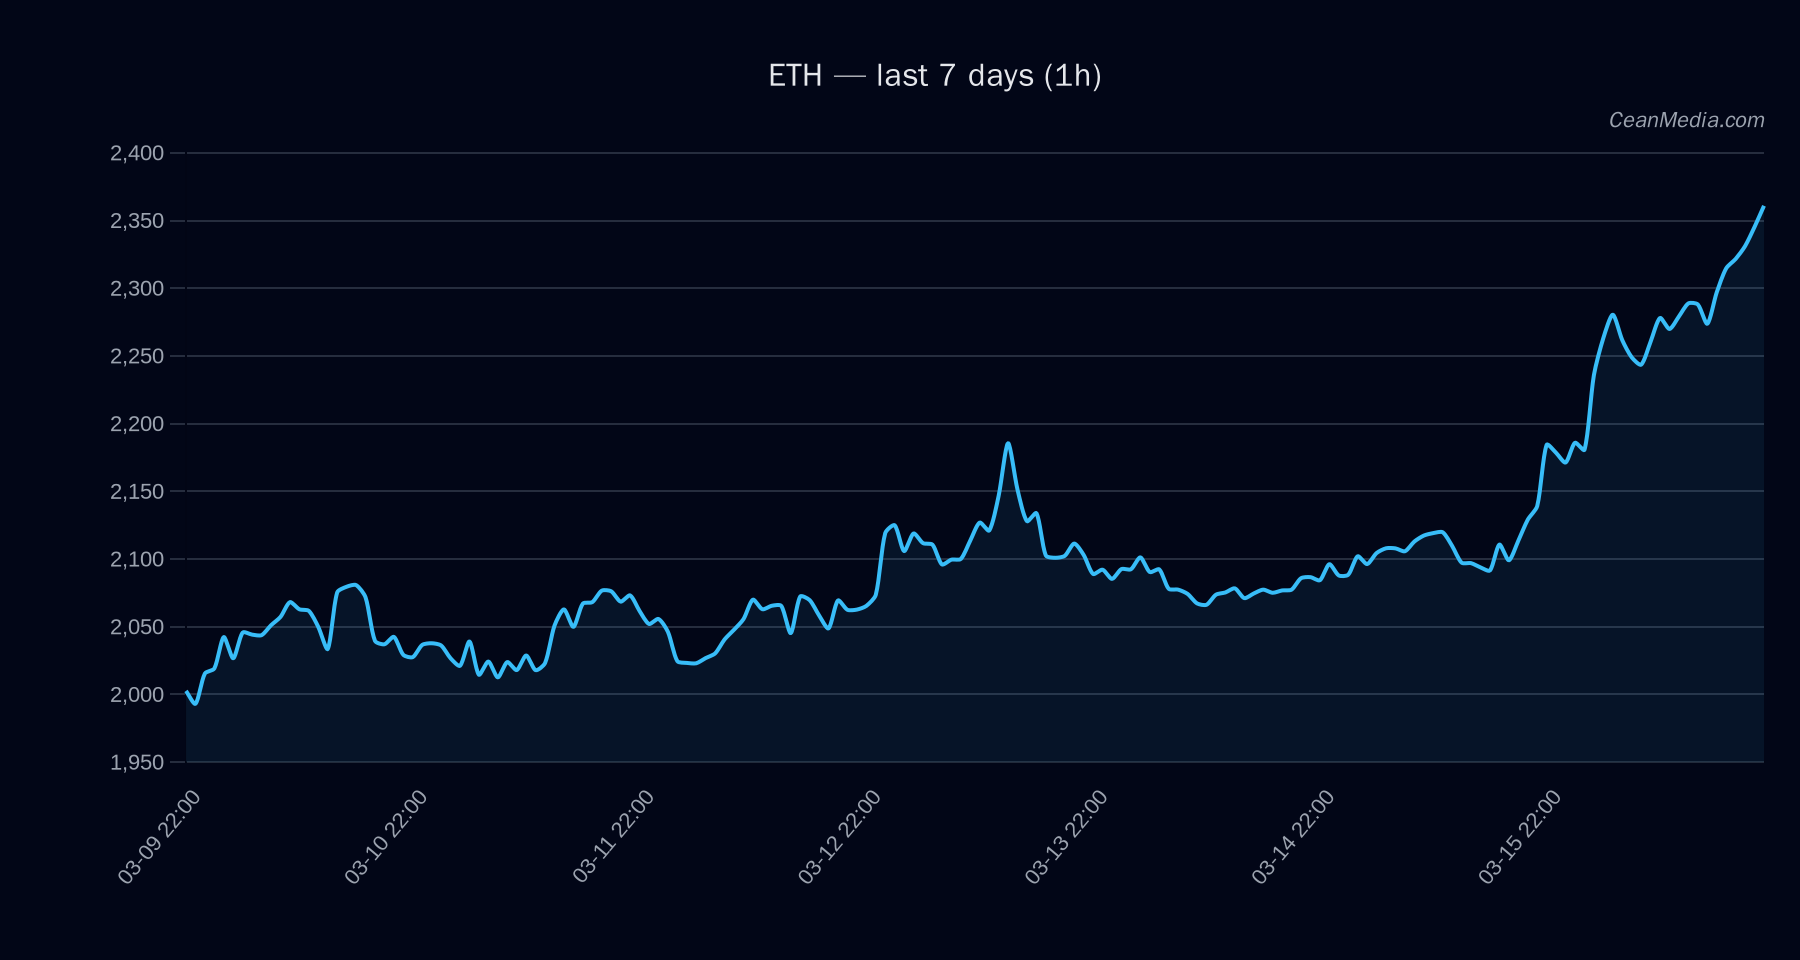
ETH sits near the middle of a defined trading range with a short-term bullish tilt. The price currently trades at approximately 2,349.21, within a band defined by major support at 2,180 and near-term resistance at 2,396. The broader context shows very low volatility and a bullish-leaning technical backdrop, though the RSI remains in overbought territory.
Technical Analysis: ETH
- Current price: 2,349.21
- Bias: Up (50% probability in the near term)
- Key levels:
- Major Support: 2,180
- Near Support: 2,302
- Near Resistance: 2,396
- Major Resistance: 2,130 (proximate lower reference)
- Break targets: Break above 2,396 → potential 2,444.12 to 2,492.04; Break below 2,302 → potential 2,256.18 to 2,210.14
- Momentum indicators:
- EMA12 > EMA26
- SMA50 > SMA200
- RSI: 79 (overbought)
- Volatility: σ24h ≈ 0.80% (Very low)
- Vol regime: Very low
- Forecast: Up (confidence ≈ 49.9% in the 24h horizon, wide band not indicated)
- Context signals: Breadth >50h 100%, BTC correlation strong (ρ 72h ≈ 0.88), ETF flows positive for BTC/ETH context
Drivers
- Return over 24h: +0.10%
- EMA slope: +0.0043
- Funding z-score: 1.08
- Basis z-score: -0.80
- Order-book imbalance (EMA5): +0.24
- BTC 24h return: +0.03%
- BTC volatility regime: Very low (0)
- BTC trend strength: 1.24
- Vol-of-vol: 0.0088
- Distance from MA: 7.63%
ETF Flows (BTC/ETH)
ETF flow data provided pertains to BTC and ETH only and should be interpreted as contextual backdrop rather than a primary signal for ETH price action. BTC and ETH ETF inflows have been predominantly positive in the near term, with BTC showing notably larger flows across 1D, 5D, and 10D windows, while ETH shows smaller but positive 1D flows and modest 5D/10D movement. This context suggests risk-on sentiment in broader markets but should not be treated as a direct ETH buy signal.
- BTC ETF: 1D +$180.4M | 5D +$143.9M | 10D +$230.3M
- ETH ETF: 1D +$34.3M | 5D +$13.3M | 10D -$24.2M
What to Watch Next
- Close above 2,396 to confirm bullish continuation and target toward 2,444–2,492.
- Break below 2,302 to invalidate near-term bullish bias and expose 2,256–2,210.
- Monitor RSI for divergence risks as price tests resistance to avoid overstretch conditions.
- Keep an eye on BTC ETF flow momentum as a contextual gauge for overall market risk sentiment.
Hashtags: #ETH #Ethereum #CryptoMarkets #TechnicalAnalysis #ETFFlows #BTC #MarketView #PriceAction #Volatility #Momentum #CryptoNews #TradingStrategy