Market Snapshot
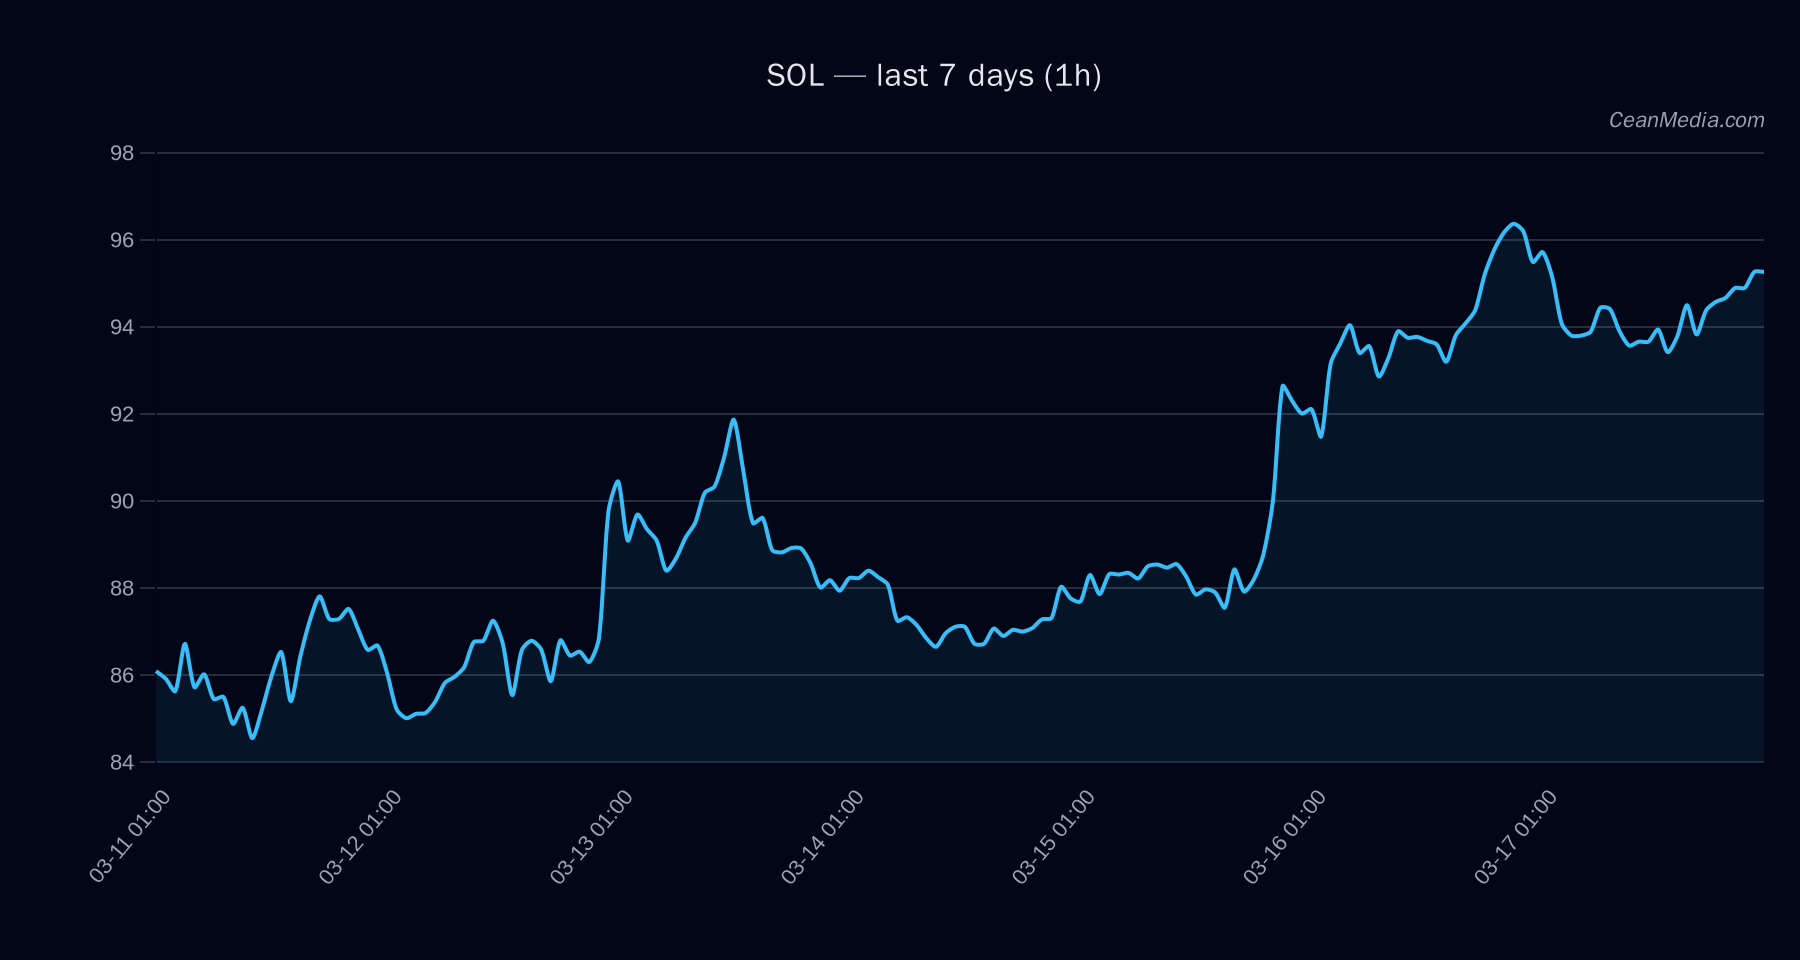
Solana (SOL) is trading around the mid-90s with near-term support at 93 and resistance at 96.8. The latest TA indicates a bullish bias within a tight range, supported by EMA alignment and a neutral RSI. Overall breadth indicators point toward constructive market breadth, while volatility remains very low.
Technical Analysis: SOL
Between 93 (near-term support) and 96.8 (near-term resistance). Major support 90.2; Major resistance 93.2; Break above 96.8 targets 98.77–100.70. Forecast is bullish with a 48% probability of upside in the short term; EMA12 > EMA26 and SMA50 > SMA200 support a positive trend; RSI at 59 indicates room to move higher but remains in neutral territory. 24h sigma 0.46% and very low vol regime suggest consolidation or quiet price action in the near term. Break below 93 invalidates the near-term upside, with a downside range toward 89.31–91.17 noted in the model.
Drivers
Return 24H: -0.94%; EMA slope: +0.15%; OBImbalance (EMA5): -0.38%; BTC 24H return: +0.38%; BTC Trend Strength: 0.17. Vol regime: Very low; vol of vol: 1.0%; distance from moving averages: +2.9% (approx). Breadth > 50h at 83%; BTC dominance around 56.8% with a small dip over 7 days; overall market breadth supports cautious bullish sentiment.
ETF Flows (BTC/ETH)
The ETF flows data provided focuses on BTC and ETH. BTC ETF flows show positive liquidity inflows across 1D, 5D, and 10D horizons (1D: +$199.4M; 5D: +$692.2M; 10D: +$457.2M). ETH ETF inflows are positive as well (1D: +$38.0M; 5D: +$142.8M; 10D: +$55.5M).
Interpretation note: ETF data for BTC/ETH is contextual and should not be treated as the primary signal for SOL. The BTC/ETH ETF flows provide macro risk-on/off context, liquidity signals, and sentiment backdrop that can influence cross-asset correlations, but SOL-specific drivers (on-chain activity, Solana network fundamentals, and SOL-specific order flow) remain essential for asset-specific trading decisions.
What to Watch Next
- Watch for a daily close above 96.8 to target 98.77–100.70.
- Monitor a break below 93 for potential weakness toward 91.17–89.31.
- Keep an eye on BTC/ETH ETF flow shifts as a risk-on/off backdrop that may influence correlated markets.
- Observe volume and vol regime signals for confirmation of a breakout or continuation in SOL momentum.
Hashtags: #Solana #SOL #CryptoMarkets #TechnicalAnalysis #ETFFlows #BTC #ETH #MarketSnapshot #PriceAction #CryptoNews