
Market Snapshot
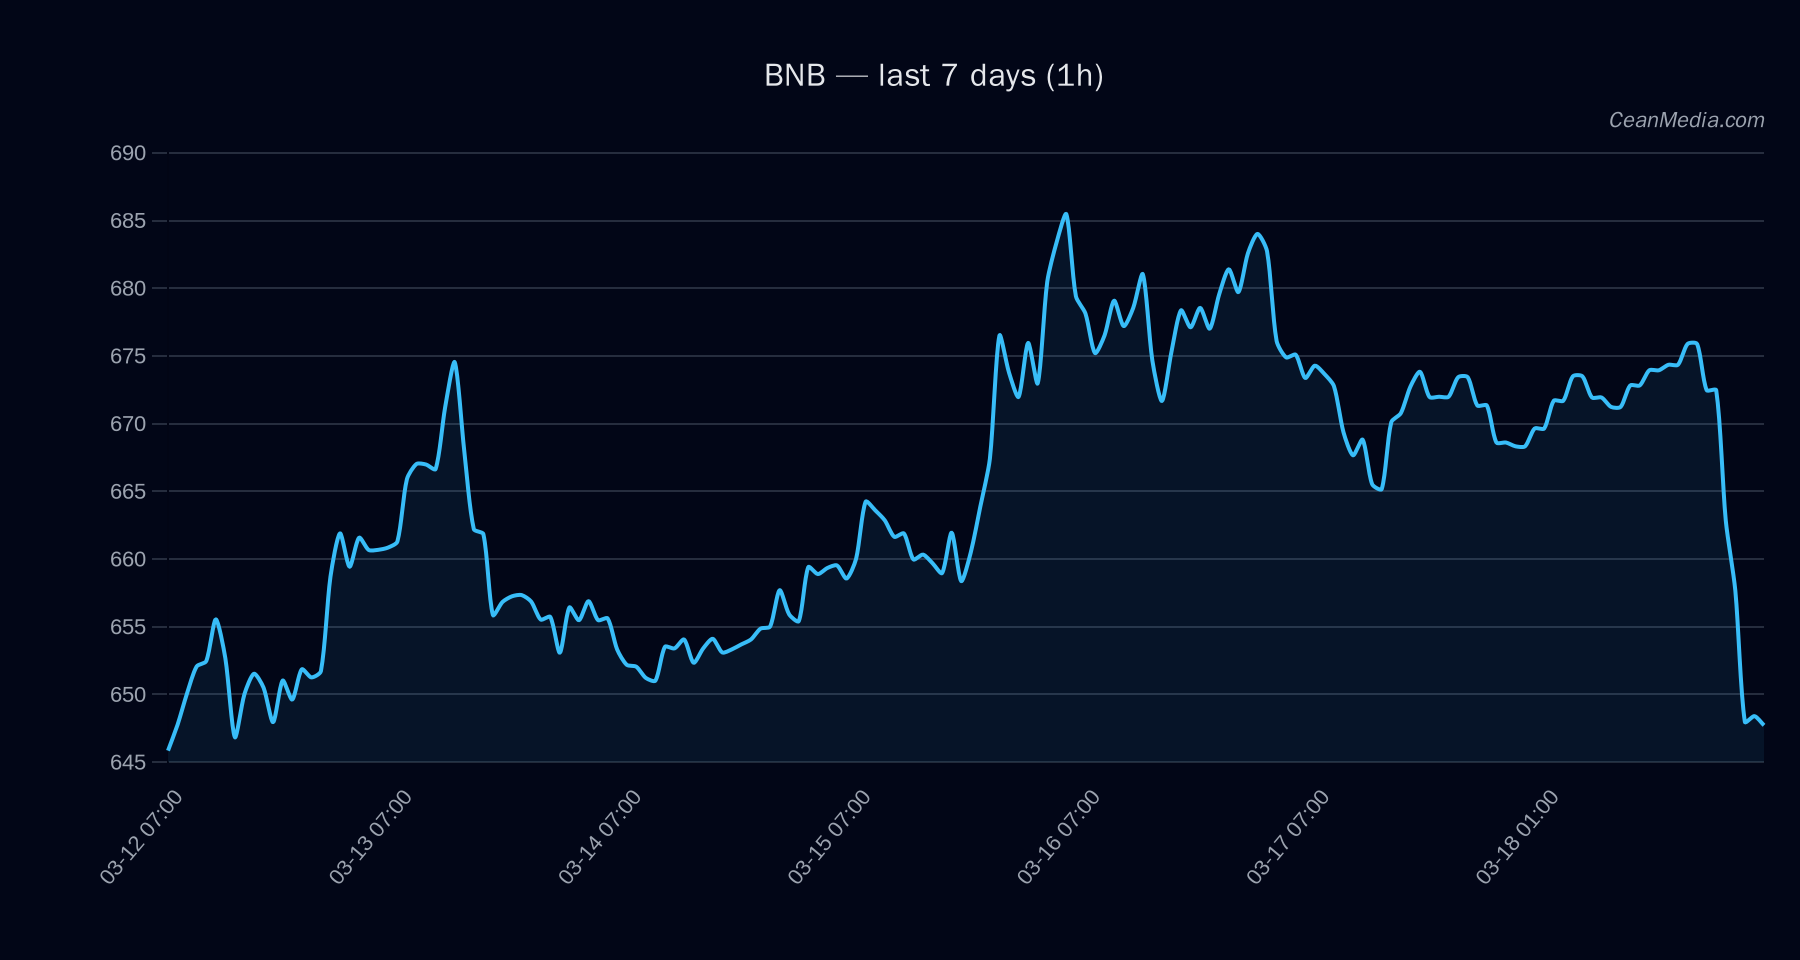
BNB trades around the mid-600s with a short-term upside bias indicated, though the immediate context shows oversold conditions on the RSI and very low volatility. The price is testing key supports near 635 and a resistance band around 661–673. The prevailing context suggests caution near the watchpoints while a break above 661 could extend toward 674–687, and a break below 635 could target 622–610 range.
Technical Analysis: BNB
- Price: 648
- Bias / Forecast: Up (58% probability over 24h)
- Key Levels: Support major ~622; Near-term support ~635; Resistance near 661; Major resistance ~673
- Expected Triggers: Break > 661 → potential move to 674–687; Break < 635 → potential move to 622–609
- Momentum / Signals: RSI 23 (oversold); EMA12 < EMA26; SMA50 > SMA200; Volatility regime: Very low
- Band / Range: P20–P80: 616.42 – 652.19; P50: 631.25
- Top Drivers:
- Return 24h: -0.04%
- EMA Slope: -0.0036
- Order-Book Imbalance (EMA5): -0.11
- BTC Return 24h: -0.04%
- BTC Trend Strength: 1.59
- Invalidation / Critical Note: RSI oversold implies potential near-term bounce, but price action must confirm above 661 for a sustained upside. A break below 635 weakens the short-term setup.
Drivers
- Top factors: 24h return, EMA slope, order-book imbalance (EMA5), BTC return, BTC trend strength
- Momentum / Volatility: Very low volatility regime; BTC-related signals show modest correlation with recent price moves.
- Context: Market breadth remains limited; overall risk sentiment is cautious with a Fear/Greed proxy in the mid-20s range.
ETF Flows (BTC/ETH)
Context for market environment comes from BTC and ETH ETF flow data. BTC ETFs show +$30.1M in 1D inflow, +$664.5M over 5D, and +$292.3M over 10D. ETH ETFs show -$8.3M in 1D but +$134.2M over 5D and +$18.2M over 10D. These figures reflect broad risk-on/off sentiment and macro liquidity shifts rather than a direct signal for BNB-specific moves.
Interpretation: The BTC ETF inflows suggest a constructive near-term risk-on backdrop for BTC, while ETH flows are mixed. This external liquidity context can influence altcoins indirectly, but it should not be treated as a primary signal for BNB positioning. Traders should weigh BNB’s own technicals and on-chain signals in addition to, and separately from, ETF flow context.
What to Watch Next
- Watch for a daily close above 661 to validate the upside trigger toward 674–687.
- Monitor the 635 support level for downside validation; a break below 635 could accelerate toward 622–609.
- RSI remains oversold; any sustained move above 40–45 could signal early bullish momentum alongside price action confirmation.
- Keep an eye on Bitcoin-related reaction and overall market breadth, as external liquidity shifts may influence risk appetite for altcoins.
Hashtags: #BNB #CryptoAnalysis #TechnicalAnalysis #Altcoins #ETFFlows #CryptoMarkets #MarketUpdate #TradingStrategy #RiskManagement #Liquidity #Bitcoin #Ethereum