Market Snapshot
On 2026-03-23, LINK trades around the mid-8.5s, with a short-term forecast leaning toward upside (probability ~50%). The instrument sits between a near-term support of 8.42 and a near-term resistance of 8.76, with a Major resistance at 9.42 and Major support at 8.7. The current context shows very low volatility, subdued breadth, and a mixed risk backdrop as reflected in the broader crypto dynamics and BTC indicators.
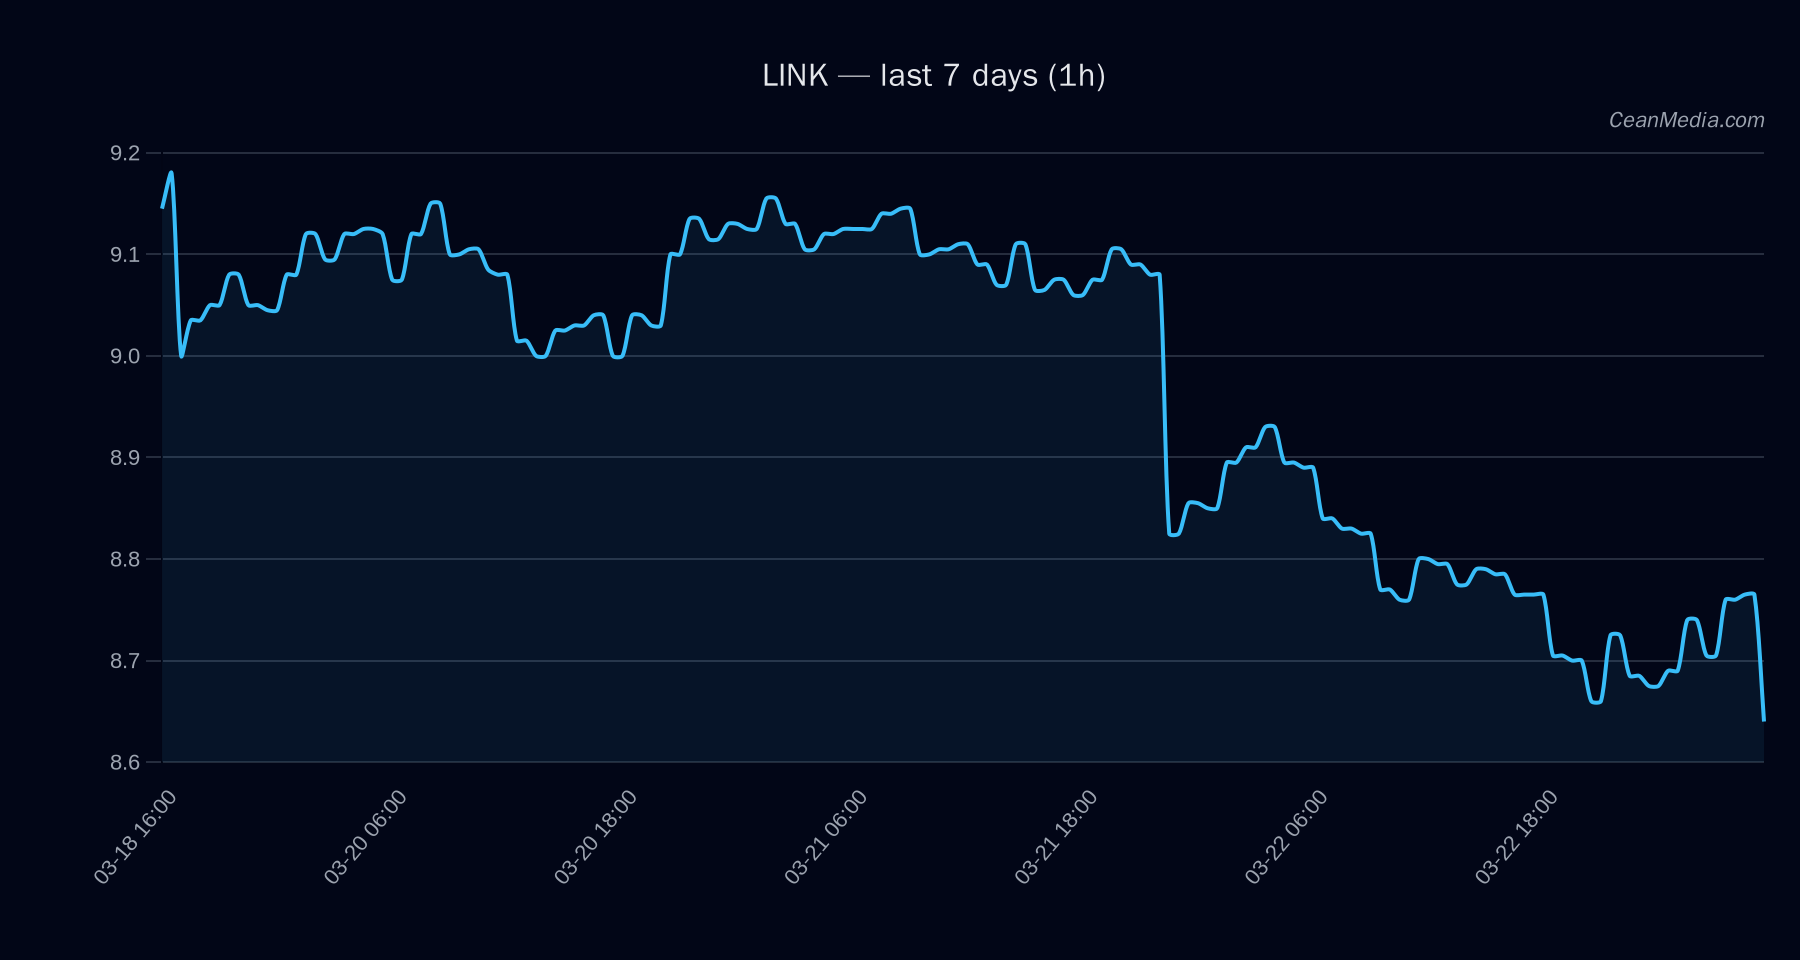
Technical Analysis: LINK
- Current price: 8.59
- Bias: Up (50% probability, 8.56–9.11 target band if breakout occurs)
- Key levels:
- Support (Major): 8.7
- Support (Near): 8.42
- Resistance (Near): 8.76
- Resistance (Major): 9.42
- Breakout/invalidation levels:
- Upside trigger: 1h close > 8.76, target 8.937–9.1123
- Downside trigger: 1h close < 8.42, target 8.2498–8.0815
- Indicators: EMA12
- Momentum: EMA slope slightly negative; trend strength indicates modest downside pressure in the immediate term despite an overall 50%Upside forecast
- Distance from MA: -3.58% below the primary moving averages
- Overall TA: Bearish under the stated conditions (EMA cross and RSI) with a balanced near-term upside potential if price closes above 8.76.
Drivers
- Top drivers: Return 24h (-0.03), EMA slope (-0.0017)
- Order-book imbalance (EMA5): +0.031
- BTC return 24h: -0.019
- BTC trend strength: 0.74; BTC volatility regime: 0 (neutral)
- Volatility regime: Very low; breadth context: below 50
- Distance from MA and drawdown signals align with a cautious stance for LINK in the near term
ETF Flows (BTC/ETH)
Contextual note: ETF flow data shown here pertains only to BTC and ETH and is intended as macro-market context, not a primary signal for LINK. The data indicates shifts in risk-on/risk-off sentiment that can influence correlated crypto markets or risk parity traders.
- BTC ETF: 1D flow -$52.0M, 5D flow +$131.4M, 10D flow +$275.3M
- ETH ETF: 1D flow -$42.0M, 5D flow +$63.8M, 10D flow +$77.1M
What to Watch Next
- Monitor price action around 8.76 for a confirmed break to the 8.93–9.11 target zone.
- Watch for a close above 8.76 with increasing volume to validate upside momentum.
- Close attention to BTC/ETH flow shifts that could signal broader risk-on or risk-off regimes, even though LINK is not directly signalized by ETF data.
- If price breaks below 8.42, evaluate the next support cluster around 8.25–8.08 for potential reversal or acceleration lower.
Hashtags: #LINK #CryptoAnalysis #TechnicalAnalysis #ETFFlows #BTC #ETH #MarketSnapshot #PriceAction #Liquidity #RiskOn #MarketStructure