Market Snapshot
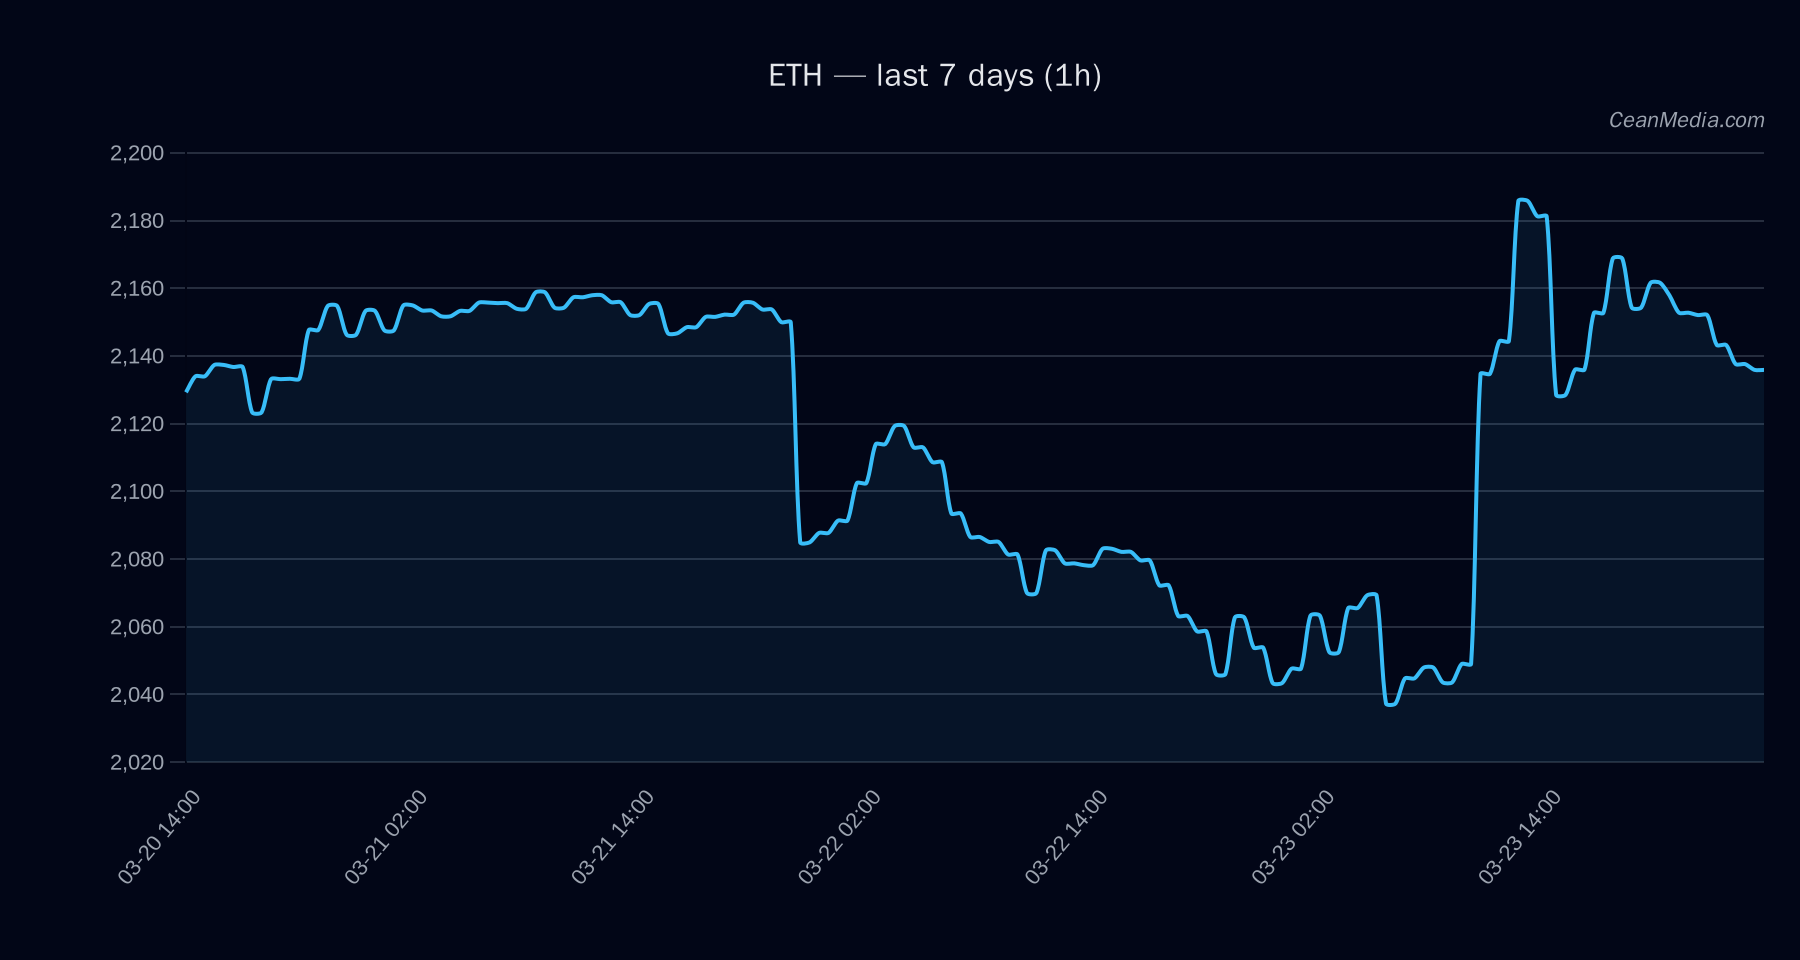
ETH trades around the 2,140 level with a near-term bias described as up by the model, though the distribution of probabilities shows a split between upside and downside. Market breadth remains constructive, with breadth indicators indicating broad participation in the move. Key distance metrics place ETH between a near-term support at 1,978–2,098 and resistance at 2,184–2,308, providing a defined range for intraday to short-term trading considerations.
Technical Analysis: ETH
- Price: 2,140.75
- Bias/Forecast: Up (47% probability) with notable sideways nuances in the immediate backdrop
- Key Indicators: EMA12>EMA26, SMA50
- Band / Range: P20–P80: 1,904.81 – 2,253.22; P50: 2,060.28
- Support: Major 1,978; Near 2,098
- Resistance: Major 2,308; Near 2,184
- Upside Trigger: 1h close > 2,184 to target 2,227.24 – 2,270.91
- Downside Trigger: 1h close < 2,098 to target 2,055.98 – 2,014.02
- Invalidation/Equivocal Signals: No strong bearish setup identified; current RSI at neutral 55 supports a balanced view
Drivers
- Return 24h: +0.04%
- EMA Slope: slight negative tilt (-0.0005)
- Order-book Imbalance (EMA5): 0.06
- BTC Return 24h: +0.03%
- BTC Vol Regime: 1 (Low-Moderate volatility context)
- BTC Trend Strength: 0.78
- Vol Regime: Low; Breadth: 100%
ETF Flows (BTC/ETH)
Contextual note: ETF data provided here covers BTC and ETH only and should be interpreted as supplementary context, not a primary signal for ETH trading decisions.
- BTC ETF: -$52.0M (1D) | +$131.4M (5D) | +$275.3M (10D)
- ETH ETF: -$42.0M (1D) | +$63.8M (5D) | +$77.1M (10D)
The ETF flow data suggests a modest, mixed flow direction across BTC and ETH over different horizons. While ETH ETF flows are positive on slightly longer horizons, the immediate term shows a modest outflow. This should be considered as supplementary context rather than a standalone driver for ETH price action.
What to Watch Next
- Break above 2,184 would open a path toward 2,227.24 – 2,270.91 if sustained.
- Break below 2,098 would shift the near-term risk toward 2,055.98 – 2,014.02.
- Monitor intraday volume and balance signals (EMA5 vs price) for potential acceleration or consolidation.
- Keep an eye on BTC market signals and overall risk appetite, given the cross-asset correlation backdrop.
Hashtags: #ETH #crypto #cryptomarket #trading #technicalanalysis #ETFflows #BTC #macro #riskmanagement #priceaction #volatility #markets